29
/
en
AIzaSyAYiBZKx7MnpbEhh9jyipgxe19OcubqV5w
April 1, 2024
41278
Latin America & Caribbean
LCN
false
2
1
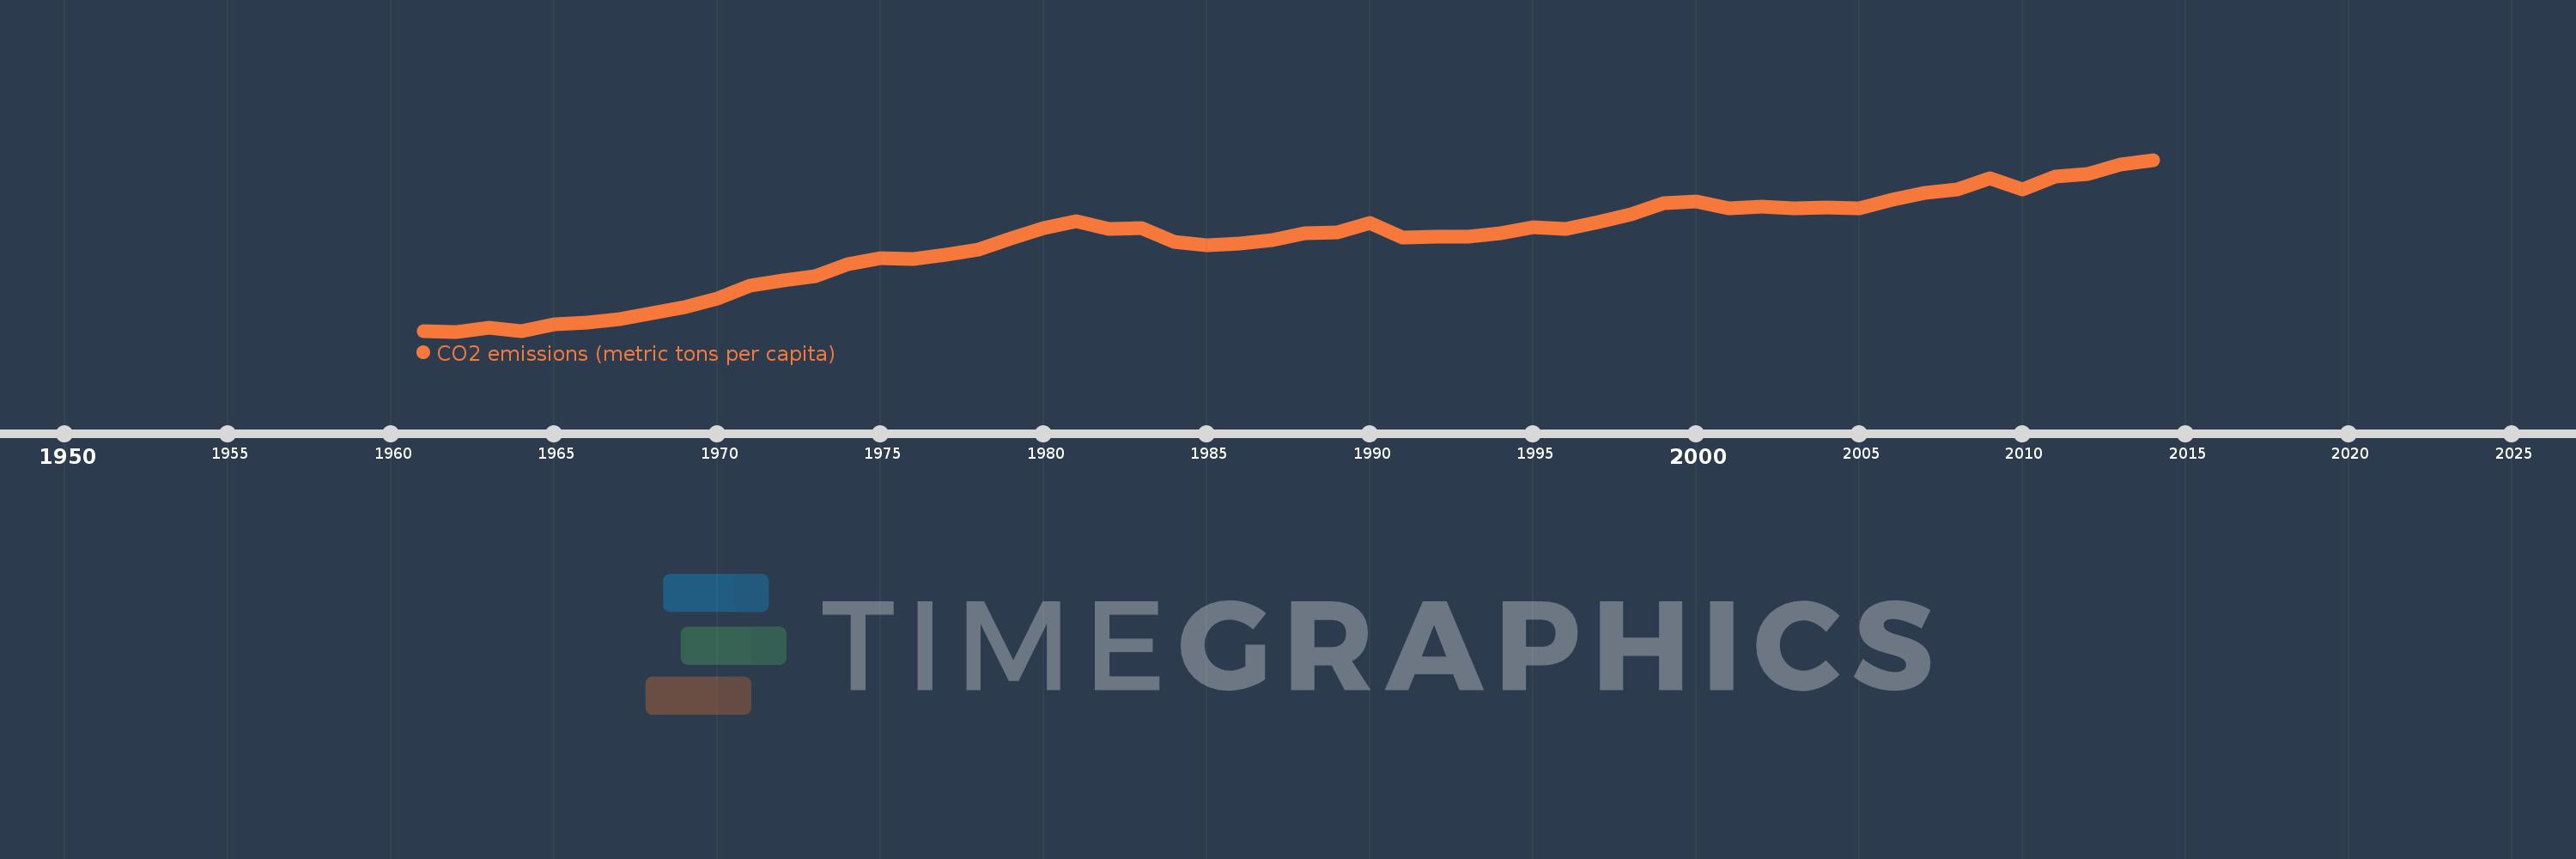
CO2 emissions (metric tons per capita)
2014,2013,2012,2011,2010,2009,2008,2007,2006,2005,2004,2003,2002,2001,2000,1999,1998,1997,1996,1995,1994,1993,1992,1991,1990,1989,1988,1987,1986,1985,1984,1983,1982,1981,1980,1979,1978,1977,1976,1975,1974,1973,1972,1971,1970,1969,1968,1967,1966,1965,1964,1963,1962,1961
This statistics in other country:
AfghanistanAlbaniaAlgeriaAndorraAngolaAntigua and BarbudaArab WorldArgentinaArmeniaArubaAustraliaAustriaAzerbaijanBahamas, TheBahrainBangladeshBarbadosBelarusBelgiumBelizeBeninBermudaBhutanBoliviaBosnia and HerzegovinaBotswanaBrazilBritish Virgin IslandsBrunei DarussalamBulgariaBurkina FasoBurundiCabo VerdeCambodiaCameroonCanadaCaribbean small statesCayman IslandsCentral African RepublicCentral Europe and the BalticsChadChileChinaColombiaComorosCongo, Dem. Rep.Congo, Rep.Costa RicaCote d'IvoireCroatiaCubaCuracaoCyprusCzech RepublicDenmarkDjiboutiDominicaDominican RepublicEarly-demographic dividendEast Asia & PacificEast Asia & Pacific (excluding high income)East Asia & Pacific (IDA & IBRD countries)EcuadorEgypt, Arab Rep.El SalvadorEquatorial GuineaEritreaEstoniaEthiopiaEuro areaEurope & Central AsiaEurope & Central Asia (excluding high income)Europe & Central Asia (IDA & IBRD countries)European UnionFaroe IslandsFijiFinlandFragile and conflict affected situationsFranceFrench PolynesiaGabonGambia, TheGeorgiaGermanyGhanaGibraltarGreeceGreenlandGrenadaGuatemalaGuineaGuinea-BissauGuyanaHaitiHeavily indebted poor countries (HIPC)High incomeHondurasHong Kong SAR, ChinaHungaryIBRD onlyIcelandIDA & IBRD totalIDA blendIDA onlyIDA totalIndiaIndonesiaIran, Islamic Rep.IraqIrelandIsraelItalyJamaicaJapanJordanKazakhstanKenyaKiribatiKorea, Dem. People’s Rep.Korea, Rep.KuwaitKyrgyz RepublicLao PDRLate-demographic dividendLatin America & Caribbean Latin America & Caribbean (excluding high income)Latin America & the Caribbean (IDA & IBRD countries)LatviaLeast developed countries: UN classificationLebanonLesothoLiberiaLibyaLiechtensteinLithuaniaLow & middle incomeLow incomeLower middle incomeLuxembourgMacao SAR, ChinaMacedonia, FYRMadagascarMalawiMalaysiaMaldivesMaliMaltaMarshall IslandsMauritaniaMauritiusMexicoMicronesia, Fed. Sts.Middle East & North AfricaMiddle East & North Africa (excluding high income)Middle East & North Africa (IDA & IBRD countries)Middle incomeMoldovaMongoliaMontenegroMoroccoMozambiqueMyanmarNamibiaNauruNepalNetherlandsNew CaledoniaNew ZealandNicaraguaNigerNigeriaNorth AmericaNorwayOECD membersOmanOther small statesPacific island small statesPakistanPalauPanamaPapua New GuineaParaguayPeruPhilippinesPolandPortugalPost-demographic dividendPre-demographic dividendQatarRomaniaRussian FederationRwandaSamoaSao Tome and PrincipeSaudi ArabiaSenegalSerbiaSeychellesSierra LeoneSingaporeSint Maarten (Dutch part)Slovak RepublicSloveniaSmall statesSolomon IslandsSomaliaSouth AfricaSouth AsiaSouth Asia (IDA & IBRD)South SudanSpainSri LankaSt. Kitts and NevisSt. LuciaSt. Vincent and the GrenadinesSub-Saharan Africa Sub-Saharan Africa (excluding high income)Sub-Saharan Africa (IDA & IBRD countries)SudanSurinameSwazilandSwedenSwitzerlandSyrian Arab RepublicTajikistanTanzaniaThailandTimor-LesteTogoTongaTrinidad and TobagoTunisiaTurkeyTurkmenistanTurks and Caicos IslandsUgandaUkraineUnited Arab EmiratesUnited KingdomUnited StatesUpper middle incomeUruguayUzbekistanVanuatuVenezuela, RBVietnamWest Bank and GazaWorldYemen, Rep.ZambiaZimbabwe Timeline:
This timeline shows a graph from 1961 to 2014 of Latin America & Caribbean . No data until 1960. Number of actual observations by date: 54.
Source name:
World Development Indicators
Source organization:
Carbon Dioxide Information Analysis Center, Environmental Sciences Division, Oak Ridge National Laboratory, Tennessee, United States.
Categories, topics:
Climate Change, Environment
Last updated:
apr 23, 2017
Indicators value changes by year
At the date of observation
Value
Absolute change
Change from previous value
jan 1, 1961
1.32
+1.32
0.0%
jan 1, 1962
1.313
-0.007
-0.55%
jan 1, 1963
1.355
+0.041
3.15%
jan 1, 1964
1.318
-0.036
-2.68%
jan 1, 1965
1.388
+0.07
5.31%
jan 1, 1966
1.4
+0.011
0.81%
jan 1, 1967
1.435
+0.035
2.5%
jan 1, 1968
1.501
+0.066
4.62%
jan 1, 1969
1.561
+0.06
4.02%
jan 1, 1970
1.647
+0.086
5.51%
jan 1, 1971
1.772
+0.125
7.59%
jan 1, 1972
1.823
+0.051
2.86%
jan 1, 1973
1.866
+0.043
2.38%
jan 1, 1974
1.988
+0.122
6.51%
jan 1, 1975
2.053
+0.065
3.27%
jan 1, 1976
2.042
-0.011
-0.54%
jan 1, 1977
2.089
+0.047
2.32%
jan 1, 1978
2.135
+0.046
2.2%
jan 1, 1979
2.249
+0.113
5.31%
jan 1, 1980
2.354
+0.105
4.69%
jan 1, 1981
2.42
+0.066
2.78%
jan 1, 1982
2.343
-0.076
-3.15%
jan 1, 1983
2.354
+0.01
0.43%
jan 1, 1984
2.211
-0.143
-6.07%
jan 1, 1985
2.18
-0.031
-1.41%
jan 1, 1986
2.197
+0.018
0.8%
jan 1, 1987
2.236
+0.038
1.75%
jan 1, 1988
2.302
+0.066
2.96%
jan 1, 1989
2.312
+0.01
0.44%
jan 1, 1990
2.402
+0.09
3.89%
jan 1, 1991
2.262
-0.14
-5.82%
jan 1, 1992
2.267
+0.005
0.23%
jan 1, 1993
2.267
-0.001
-0.04%
jan 1, 1994
2.297
+0.031
1.36%
jan 1, 1995
2.36
+0.062
2.71%
jan 1, 1996
2.344
-0.016
-0.67%
jan 1, 1997
2.412
+0.068
2.91%
jan 1, 1998
2.492
+0.08
3.32%
jan 1, 1999
2.599
+0.106
4.27%
jan 1, 2000
2.619
+0.02
0.79%
jan 1, 2001
2.549
-0.07
-2.69%
jan 1, 2002
2.571
+0.022
0.87%
jan 1, 2003
2.552
-0.018
-0.71%
jan 1, 2004
2.561
+0.009
0.35%
jan 1, 2005
2.554
-0.007
-0.27%
jan 1, 2006
2.641
+0.087
3.41%
jan 1, 2007
2.705
+0.063
2.4%
jan 1, 2008
2.739
+0.035
1.28%
jan 1, 2009
2.85
+0.11
4.03%
jan 1, 2010
2.739
-0.111
-3.9%
jan 1, 2011
2.867
+0.129
4.69%
jan 1, 2012
2.897
+0.03
1.06%
jan 1, 2013
2.994
+0.097
3.35%
jan 1, 2014
3.039
+0.044
1.48%
Ranking of countries by current statistics by years


Comments: