29
/
en
AIzaSyAYiBZKx7MnpbEhh9jyipgxe19OcubqV5w
April 1, 2024
37200
IDA & IBRD total
IBT
false
2
1
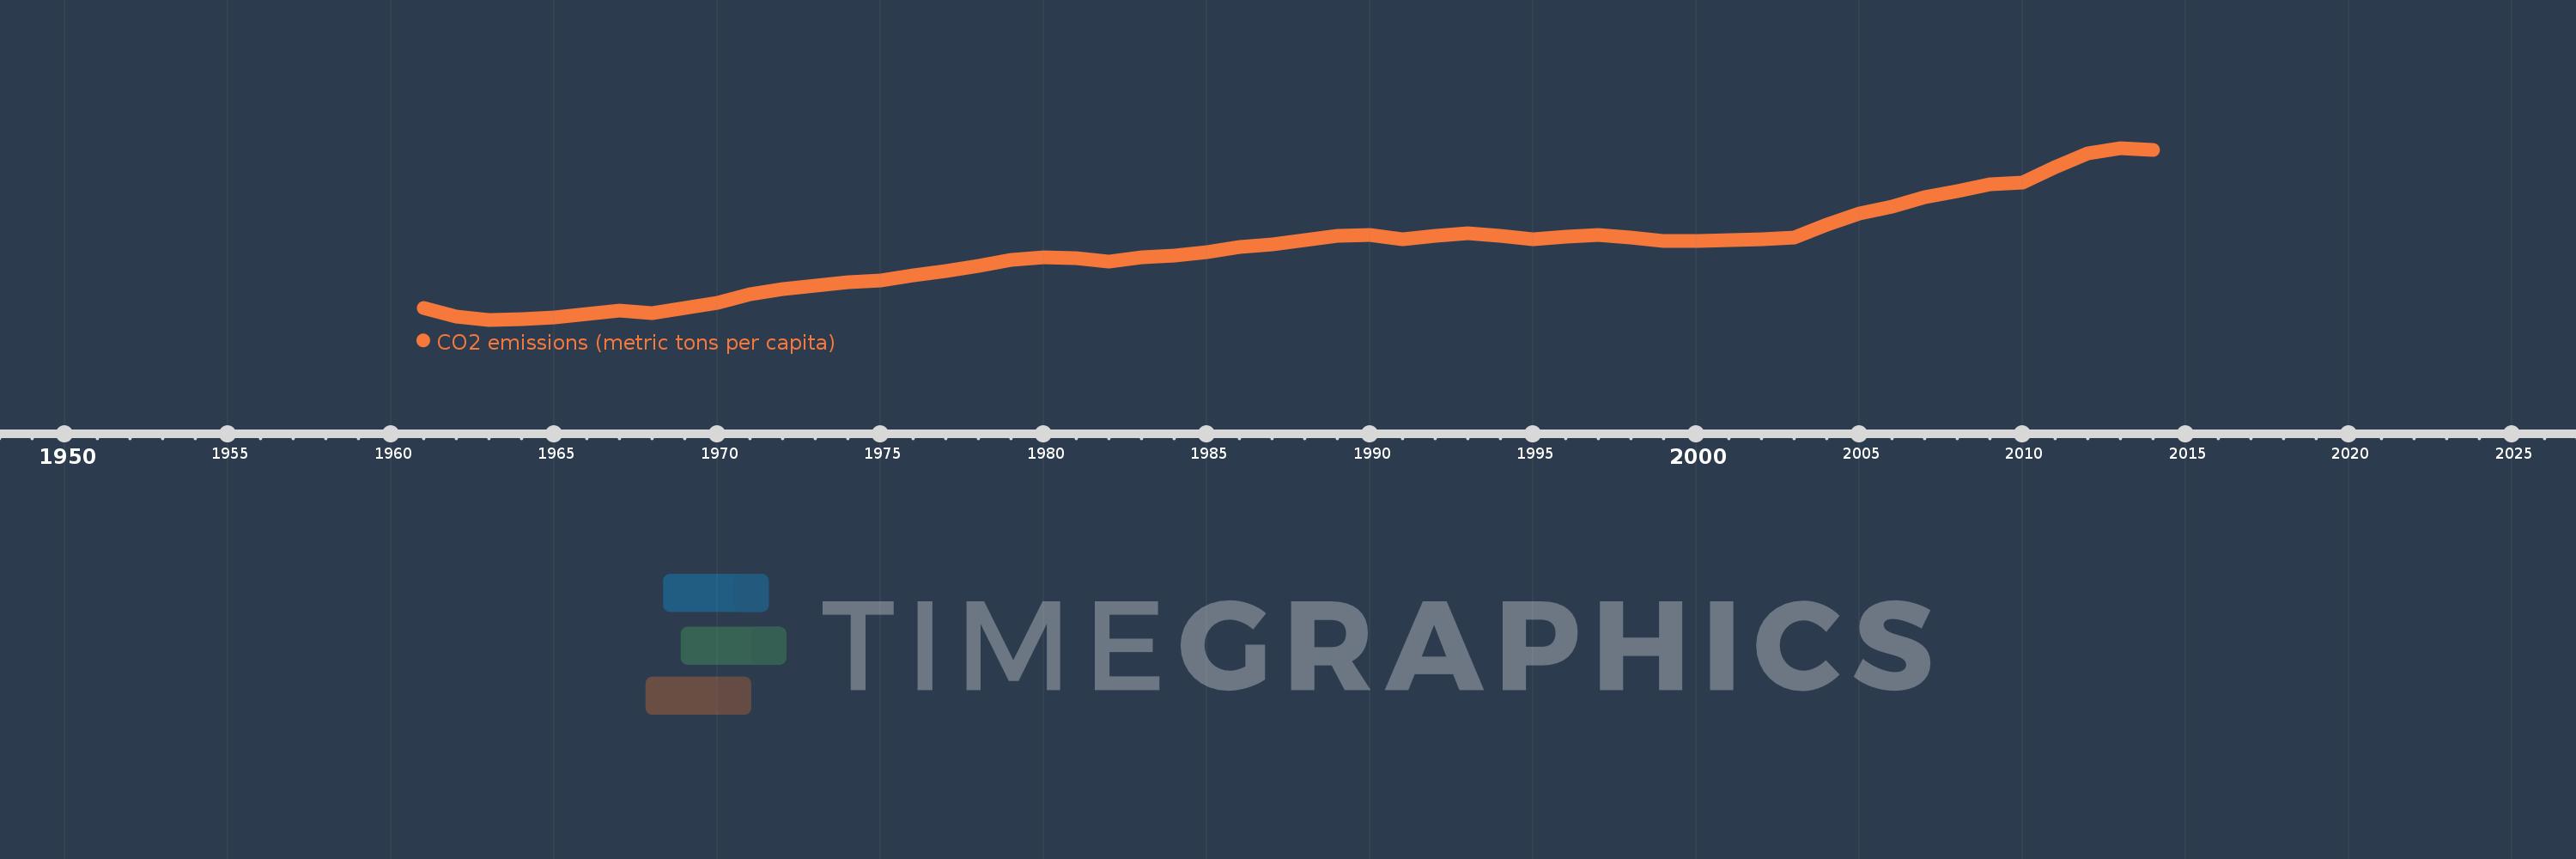
CO2 emissions (metric tons per capita)
2014,2013,2012,2011,2010,2009,2008,2007,2006,2005,2004,2003,2002,2001,2000,1999,1998,1997,1996,1995,1994,1993,1992,1991,1990,1989,1988,1987,1986,1985,1984,1983,1982,1981,1980,1979,1978,1977,1976,1975,1974,1973,1972,1971,1970,1969,1968,1967,1966,1965,1964,1963,1962,1961
This statistics in other country:
AfghanistanAlbaniaAlgeriaAndorraAngolaAntigua and BarbudaArab WorldArgentinaArmeniaArubaAustraliaAustriaAzerbaijanBahamas, TheBahrainBangladeshBarbadosBelarusBelgiumBelizeBeninBermudaBhutanBoliviaBosnia and HerzegovinaBotswanaBrazilBritish Virgin IslandsBrunei DarussalamBulgariaBurkina FasoBurundiCabo VerdeCambodiaCameroonCanadaCaribbean small statesCayman IslandsCentral African RepublicCentral Europe and the BalticsChadChileChinaColombiaComorosCongo, Dem. Rep.Congo, Rep.Costa RicaCote d'IvoireCroatiaCubaCuracaoCyprusCzech RepublicDenmarkDjiboutiDominicaDominican RepublicEarly-demographic dividendEast Asia & PacificEast Asia & Pacific (excluding high income)East Asia & Pacific (IDA & IBRD countries)EcuadorEgypt, Arab Rep.El SalvadorEquatorial GuineaEritreaEstoniaEthiopiaEuro areaEurope & Central AsiaEurope & Central Asia (excluding high income)Europe & Central Asia (IDA & IBRD countries)European UnionFaroe IslandsFijiFinlandFragile and conflict affected situationsFranceFrench PolynesiaGabonGambia, TheGeorgiaGermanyGhanaGibraltarGreeceGreenlandGrenadaGuatemalaGuineaGuinea-BissauGuyanaHaitiHeavily indebted poor countries (HIPC)High incomeHondurasHong Kong SAR, ChinaHungaryIBRD onlyIcelandIDA & IBRD totalIDA blendIDA onlyIDA totalIndiaIndonesiaIran, Islamic Rep.IraqIrelandIsraelItalyJamaicaJapanJordanKazakhstanKenyaKiribatiKorea, Dem. People’s Rep.Korea, Rep.KuwaitKyrgyz RepublicLao PDRLate-demographic dividendLatin America & Caribbean Latin America & Caribbean (excluding high income)Latin America & the Caribbean (IDA & IBRD countries)LatviaLeast developed countries: UN classificationLebanonLesothoLiberiaLibyaLiechtensteinLithuaniaLow & middle incomeLow incomeLower middle incomeLuxembourgMacao SAR, ChinaMacedonia, FYRMadagascarMalawiMalaysiaMaldivesMaliMaltaMarshall IslandsMauritaniaMauritiusMexicoMicronesia, Fed. Sts.Middle East & North AfricaMiddle East & North Africa (excluding high income)Middle East & North Africa (IDA & IBRD countries)Middle incomeMoldovaMongoliaMontenegroMoroccoMozambiqueMyanmarNamibiaNauruNepalNetherlandsNew CaledoniaNew ZealandNicaraguaNigerNigeriaNorth AmericaNorwayOECD membersOmanOther small statesPacific island small statesPakistanPalauPanamaPapua New GuineaParaguayPeruPhilippinesPolandPortugalPost-demographic dividendPre-demographic dividendQatarRomaniaRussian FederationRwandaSamoaSao Tome and PrincipeSaudi ArabiaSenegalSerbiaSeychellesSierra LeoneSingaporeSint Maarten (Dutch part)Slovak RepublicSloveniaSmall statesSolomon IslandsSomaliaSouth AfricaSouth AsiaSouth Asia (IDA & IBRD)South SudanSpainSri LankaSt. Kitts and NevisSt. LuciaSt. Vincent and the GrenadinesSub-Saharan Africa Sub-Saharan Africa (excluding high income)Sub-Saharan Africa (IDA & IBRD countries)SudanSurinameSwazilandSwedenSwitzerlandSyrian Arab RepublicTajikistanTanzaniaThailandTimor-LesteTogoTongaTrinidad and TobagoTunisiaTurkeyTurkmenistanTurks and Caicos IslandsUgandaUkraineUnited Arab EmiratesUnited KingdomUnited StatesUpper middle incomeUruguayUzbekistanVanuatuVenezuela, RBVietnamWest Bank and GazaWorldYemen, Rep.ZambiaZimbabwe Timeline:
This timeline shows a graph from 1961 to 2014 of IDA & IBRD total. No data until 1960. Number of actual observations by date: 54.
Source name:
World Development Indicators
Source organization:
Carbon Dioxide Information Analysis Center, Environmental Sciences Division, Oak Ridge National Laboratory, Tennessee, United States.
Categories, topics:
Climate Change, Environment
Last updated:
apr 23, 2017
Indicators value changes by year
At the date of observation
Value
Absolute change
Change from previous value
jan 1, 1961
1.149
+1.149
0.0%
jan 1, 1962
1.013
-0.135
-11.77%
jan 1, 1963
0.966
-0.047
-4.68%
jan 1, 1964
0.976
+0.01
1.0%
jan 1, 1965
1.003
+0.027
2.76%
jan 1, 1966
1.054
+0.051
5.1%
jan 1, 1967
1.102
+0.048
4.6%
jan 1, 1968
1.067
-0.035
-3.22%
jan 1, 1969
1.138
+0.071
6.63%
jan 1, 1970
1.226
+0.089
7.8%
jan 1, 1971
1.358
+0.132
10.73%
jan 1, 1972
1.437
+0.079
5.84%
jan 1, 1973
1.481
+0.043
3.02%
jan 1, 1974
1.541
+0.06
4.08%
jan 1, 1975
1.559
+0.018
1.19%
jan 1, 1976
1.64
+0.08
5.15%
jan 1, 1977
1.708
+0.069
4.19%
jan 1, 1978
1.782
+0.073
4.29%
jan 1, 1979
1.876
+0.094
5.28%
jan 1, 1980
1.917
+0.041
2.19%
jan 1, 1981
1.898
-0.019
-0.97%
jan 1, 1982
1.848
-0.05
-2.65%
jan 1, 1983
1.911
+0.063
3.41%
jan 1, 1984
1.936
+0.026
1.34%
jan 1, 1985
1.99
+0.054
2.77%
jan 1, 1986
2.066
+0.076
3.83%
jan 1, 1987
2.109
+0.043
2.07%
jan 1, 1988
2.176
+0.067
3.16%
jan 1, 1989
2.238
+0.062
2.86%
jan 1, 1990
2.248
+0.01
0.43%
jan 1, 1991
2.19
-0.058
-2.57%
jan 1, 1992
2.235
+0.045
2.04%
jan 1, 1993
2.272
+0.037
1.65%
jan 1, 1994
2.241
-0.031
-1.35%
jan 1, 1995
2.183
-0.058
-2.57%
jan 1, 1996
2.226
+0.043
1.96%
jan 1, 1997
2.255
+0.029
1.31%
jan 1, 1998
2.214
-0.041
-1.83%
jan 1, 1999
2.155
-0.059
-2.67%
jan 1, 2000
2.162
+0.007
0.31%
jan 1, 2001
2.178
+0.016
0.76%
jan 1, 2002
2.191
+0.013
0.59%
jan 1, 2003
2.217
+0.026
1.17%
jan 1, 2004
2.414
+0.197
8.89%
jan 1, 2005
2.581
+0.168
6.95%
jan 1, 2006
2.682
+0.1
3.89%
jan 1, 2007
2.824
+0.142
5.29%
jan 1, 2008
2.914
+0.09
3.19%
jan 1, 2009
3.023
+0.109
3.74%
jan 1, 2010
3.05
+0.027
0.89%
jan 1, 2011
3.282
+0.232
7.62%
jan 1, 2012
3.494
+0.212
6.46%
jan 1, 2013
3.571
+0.077
2.21%
jan 1, 2014
3.541
-0.03
-0.85%
Ranking of countries by current statistics by years


Comments: