29
/
en
AIzaSyAYiBZKx7MnpbEhh9jyipgxe19OcubqV5w
April 1, 2024
257110
Switzerland
CHE
true
2
1
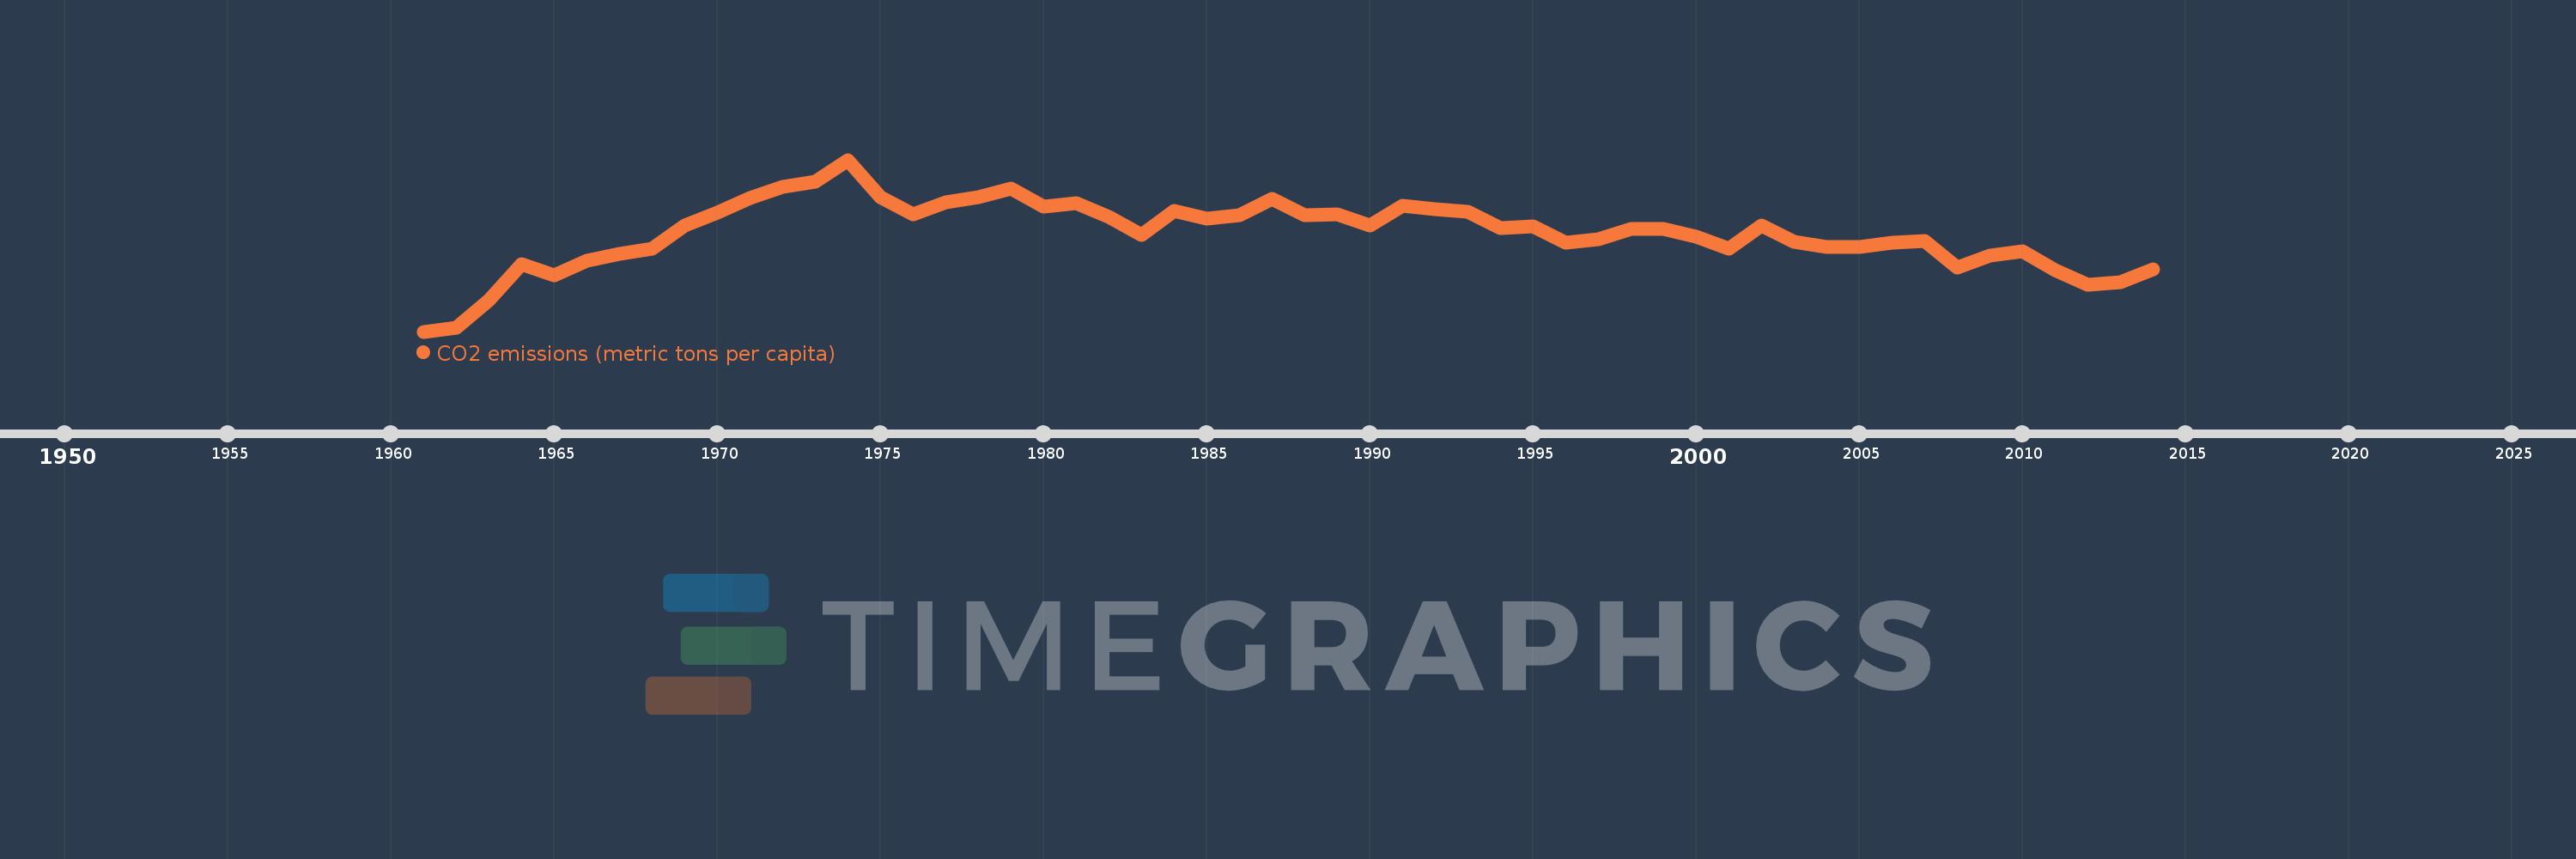
CO2 emissions (metric tons per capita)
2014,2013,2012,2011,2010,2009,2008,2007,2006,2005,2004,2003,2002,2001,2000,1999,1998,1997,1996,1995,1994,1993,1992,1991,1990,1989,1988,1987,1986,1985,1984,1983,1982,1981,1980,1979,1978,1977,1976,1975,1974,1973,1972,1971,1970,1969,1968,1967,1966,1965,1964,1963,1962,1961
This statistics in other country:
AfghanistanAlbaniaAlgeriaAndorraAngolaAntigua and BarbudaArab WorldArgentinaArmeniaArubaAustraliaAustriaAzerbaijanBahamas, TheBahrainBangladeshBarbadosBelarusBelgiumBelizeBeninBermudaBhutanBoliviaBosnia and HerzegovinaBotswanaBrazilBritish Virgin IslandsBrunei DarussalamBulgariaBurkina FasoBurundiCabo VerdeCambodiaCameroonCanadaCaribbean small statesCayman IslandsCentral African RepublicCentral Europe and the BalticsChadChileChinaColombiaComorosCongo, Dem. Rep.Congo, Rep.Costa RicaCote d'IvoireCroatiaCubaCuracaoCyprusCzech RepublicDenmarkDjiboutiDominicaDominican RepublicEarly-demographic dividendEast Asia & PacificEast Asia & Pacific (excluding high income)East Asia & Pacific (IDA & IBRD countries)EcuadorEgypt, Arab Rep.El SalvadorEquatorial GuineaEritreaEstoniaEthiopiaEuro areaEurope & Central AsiaEurope & Central Asia (excluding high income)Europe & Central Asia (IDA & IBRD countries)European UnionFaroe IslandsFijiFinlandFragile and conflict affected situationsFranceFrench PolynesiaGabonGambia, TheGeorgiaGermanyGhanaGibraltarGreeceGreenlandGrenadaGuatemalaGuineaGuinea-BissauGuyanaHaitiHeavily indebted poor countries (HIPC)High incomeHondurasHong Kong SAR, ChinaHungaryIBRD onlyIcelandIDA & IBRD totalIDA blendIDA onlyIDA totalIndiaIndonesiaIran, Islamic Rep.IraqIrelandIsraelItalyJamaicaJapanJordanKazakhstanKenyaKiribatiKorea, Dem. People’s Rep.Korea, Rep.KuwaitKyrgyz RepublicLao PDRLate-demographic dividendLatin America & Caribbean Latin America & Caribbean (excluding high income)Latin America & the Caribbean (IDA & IBRD countries)LatviaLeast developed countries: UN classificationLebanonLesothoLiberiaLibyaLiechtensteinLithuaniaLow & middle incomeLow incomeLower middle incomeLuxembourgMacao SAR, ChinaMacedonia, FYRMadagascarMalawiMalaysiaMaldivesMaliMaltaMarshall IslandsMauritaniaMauritiusMexicoMicronesia, Fed. Sts.Middle East & North AfricaMiddle East & North Africa (excluding high income)Middle East & North Africa (IDA & IBRD countries)Middle incomeMoldovaMongoliaMontenegroMoroccoMozambiqueMyanmarNamibiaNauruNepalNetherlandsNew CaledoniaNew ZealandNicaraguaNigerNigeriaNorth AmericaNorwayOECD membersOmanOther small statesPacific island small statesPakistanPalauPanamaPapua New GuineaParaguayPeruPhilippinesPolandPortugalPost-demographic dividendPre-demographic dividendQatarRomaniaRussian FederationRwandaSamoaSao Tome and PrincipeSaudi ArabiaSenegalSerbiaSeychellesSierra LeoneSingaporeSint Maarten (Dutch part)Slovak RepublicSloveniaSmall statesSolomon IslandsSomaliaSouth AfricaSouth AsiaSouth Asia (IDA & IBRD)South SudanSpainSri LankaSt. Kitts and NevisSt. LuciaSt. Vincent and the GrenadinesSub-Saharan Africa Sub-Saharan Africa (excluding high income)Sub-Saharan Africa (IDA & IBRD countries)SudanSurinameSwazilandSwedenSwitzerlandSyrian Arab RepublicTajikistanTanzaniaThailandTimor-LesteTogoTongaTrinidad and TobagoTunisiaTurkeyTurkmenistanTurks and Caicos IslandsUgandaUkraineUnited Arab EmiratesUnited KingdomUnited StatesUpper middle incomeUruguayUzbekistanVanuatuVenezuela, RBVietnamWest Bank and GazaWorldYemen, Rep.ZambiaZimbabwe Timeline:
This timeline shows a graph from 1961 to 2014 of Switzerland. No data until 1960. Number of actual observations by date: 54.
Source name:
World Development Indicators
Source organization:
Carbon Dioxide Information Analysis Center, Environmental Sciences Division, Oak Ridge National Laboratory, Tennessee, United States.
Categories, topics:
Climate Change, Environment
Last updated:
apr 23, 2017
Indicators value changes by year
At the date of observation
Value
Absolute change
Change from previous value
jan 1, 1961
3.664
+3.664
0.0%
jan 1, 1962
3.752
+0.087
2.39%
jan 1, 1963
4.334
+0.582
15.51%
jan 1, 1964
5.111
+0.778
17.95%
jan 1, 1965
4.865
-0.246
-4.81%
jan 1, 1966
5.186
+0.32
6.59%
jan 1, 1967
5.328
+0.142
2.74%
jan 1, 1968
5.435
+0.107
2.01%
jan 1, 1969
5.938
+0.503
9.26%
jan 1, 1970
6.208
+0.271
4.56%
jan 1, 1971
6.52
+0.311
5.01%
jan 1, 1972
6.75
+0.231
3.54%
jan 1, 1973
6.864
+0.113
1.68%
jan 1, 1974
7.335
+0.471
6.86%
jan 1, 1975
6.541
-0.793
-10.82%
jan 1, 1976
6.168
-0.373
-5.7%
jan 1, 1977
6.423
+0.255
4.14%
jan 1, 1978
6.541
+0.118
1.83%
jan 1, 1979
6.721
+0.18
2.75%
jan 1, 1980
6.341
-0.38
-5.65%
jan 1, 1981
6.415
+0.074
1.17%
jan 1, 1982
6.116
-0.299
-4.67%
jan 1, 1983
5.731
-0.384
-6.29%
jan 1, 1984
6.243
+0.511
8.92%
jan 1, 1985
6.081
-0.161
-2.58%
jan 1, 1986
6.155
+0.074
1.22%
jan 1, 1987
6.503
+0.347
5.65%
jan 1, 1988
6.15
-0.353
-5.43%
jan 1, 1989
6.175
+0.024
0.4%
jan 1, 1990
5.938
-0.237
-3.83%
jan 1, 1991
6.345
+0.407
6.86%
jan 1, 1992
6.28
-0.065
-1.02%
jan 1, 1993
6.224
-0.056
-0.89%
jan 1, 1994
5.873
-0.351
-5.64%
jan 1, 1995
5.909
+0.035
0.6%
jan 1, 1996
5.571
-0.337
-5.71%
jan 1, 1997
5.64
+0.069
1.23%
jan 1, 1998
5.849
+0.209
3.71%
jan 1, 1999
5.866
+0.016
0.28%
jan 1, 2000
5.696
-0.17
-2.89%
jan 1, 2001
5.435
-0.261
-4.57%
jan 1, 2002
5.94
+0.504
9.28%
jan 1, 2003
5.587
-0.353
-5.95%
jan 1, 2004
5.474
-0.112
-2.01%
jan 1, 2005
5.463
-0.012
-0.21%
jan 1, 2006
5.558
+0.096
1.75%
jan 1, 2007
5.592
+0.034
0.61%
jan 1, 2008
5.031
-0.562
-10.04%
jan 1, 2009
5.283
+0.252
5.02%
jan 1, 2010
5.378
+0.095
1.8%
jan 1, 2011
4.983
-0.395
-7.34%
jan 1, 2012
4.672
-0.311
-6.25%
jan 1, 2013
4.719
+0.047
1.01%
jan 1, 2014
4.988
+0.268
5.69%
Ranking of countries by current statistics by years


Comments: