29
/
en
AIzaSyAYiBZKx7MnpbEhh9jyipgxe19OcubqV5w
April 1, 2024
181900
Luxembourg
LUX
true
2
1
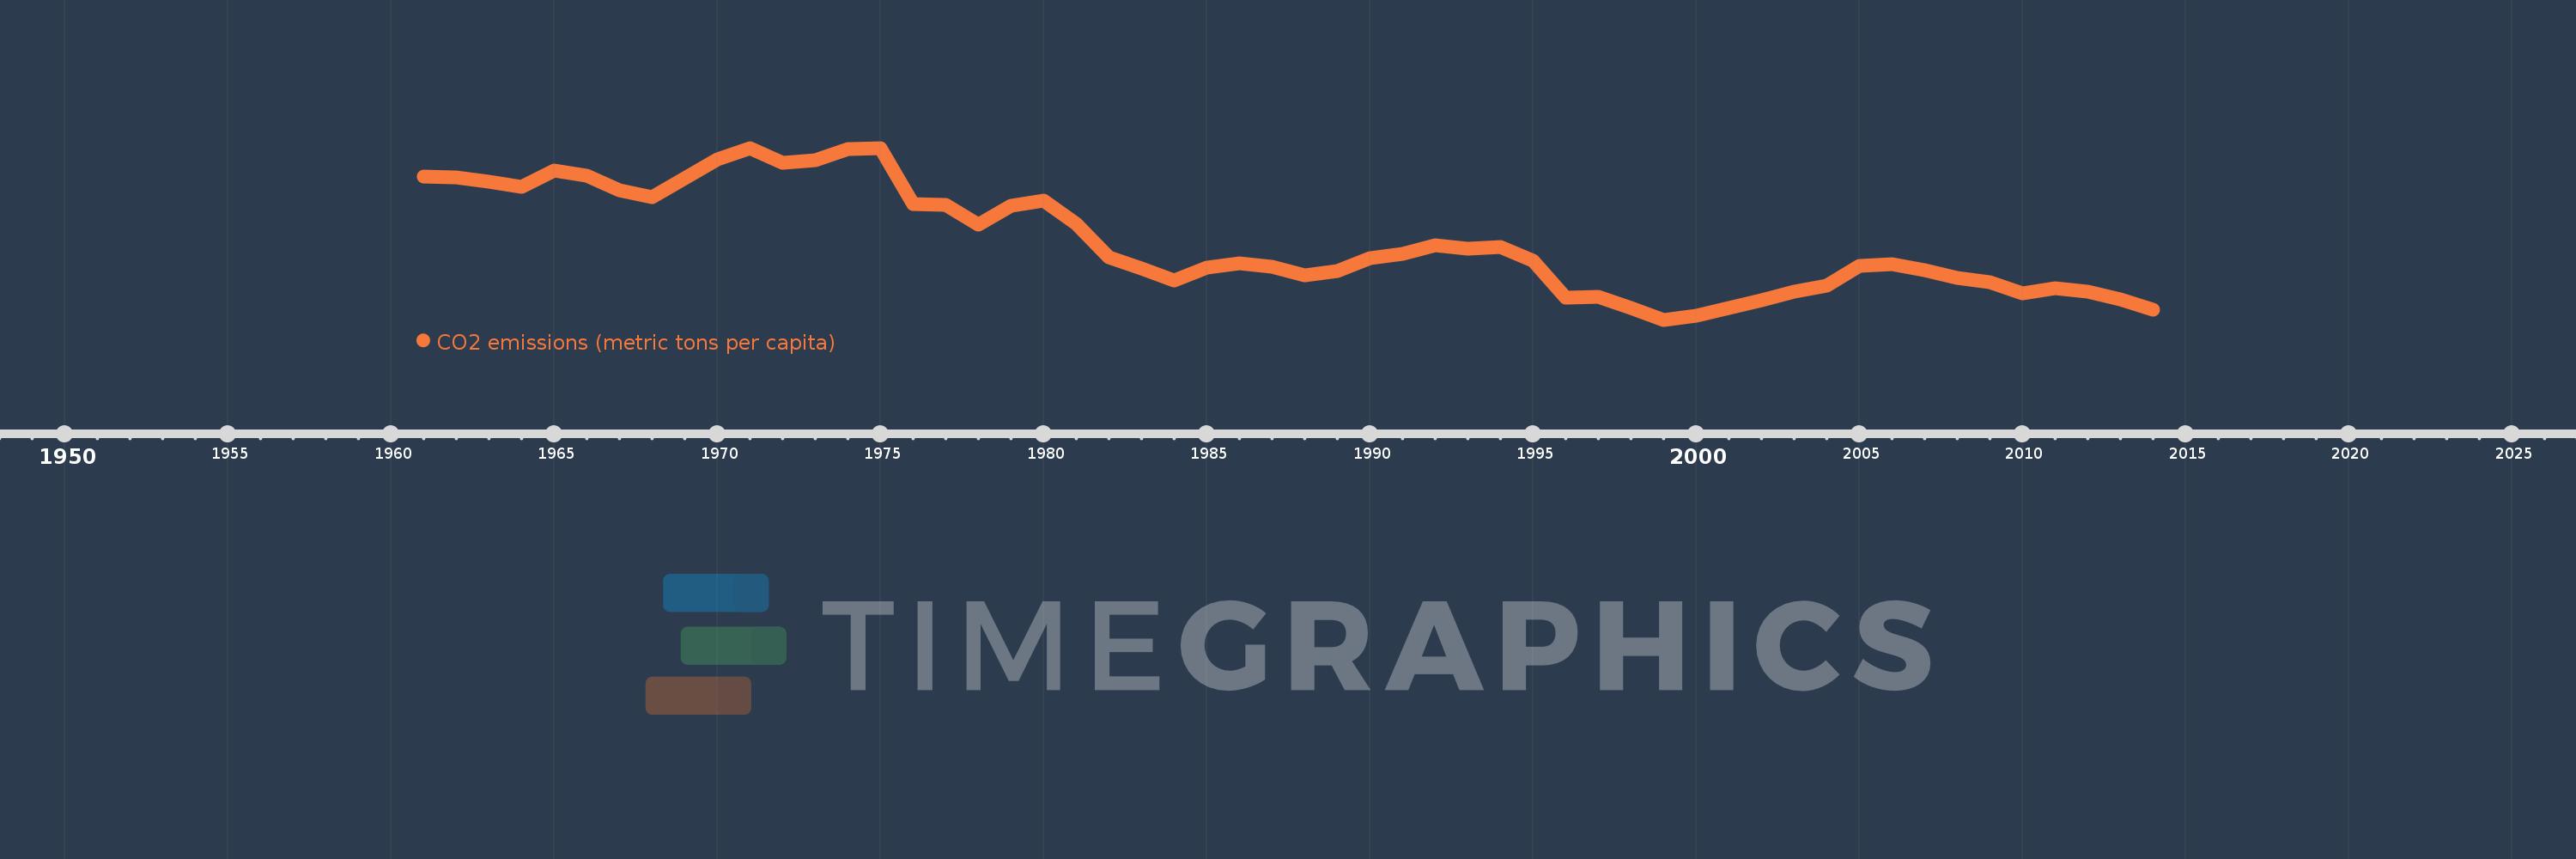
CO2 emissions (metric tons per capita)
2014,2013,2012,2011,2010,2009,2008,2007,2006,2005,2004,2003,2002,2001,2000,1999,1998,1997,1996,1995,1994,1993,1992,1991,1990,1989,1988,1987,1986,1985,1984,1983,1982,1981,1980,1979,1978,1977,1976,1975,1974,1973,1972,1971,1970,1969,1968,1967,1966,1965,1964,1963,1962,1961
This statistics in other country:
AfghanistanAlbaniaAlgeriaAndorraAngolaAntigua and BarbudaArab WorldArgentinaArmeniaArubaAustraliaAustriaAzerbaijanBahamas, TheBahrainBangladeshBarbadosBelarusBelgiumBelizeBeninBermudaBhutanBoliviaBosnia and HerzegovinaBotswanaBrazilBritish Virgin IslandsBrunei DarussalamBulgariaBurkina FasoBurundiCabo VerdeCambodiaCameroonCanadaCaribbean small statesCayman IslandsCentral African RepublicCentral Europe and the BalticsChadChileChinaColombiaComorosCongo, Dem. Rep.Congo, Rep.Costa RicaCote d'IvoireCroatiaCubaCuracaoCyprusCzech RepublicDenmarkDjiboutiDominicaDominican RepublicEarly-demographic dividendEast Asia & PacificEast Asia & Pacific (excluding high income)East Asia & Pacific (IDA & IBRD countries)EcuadorEgypt, Arab Rep.El SalvadorEquatorial GuineaEritreaEstoniaEthiopiaEuro areaEurope & Central AsiaEurope & Central Asia (excluding high income)Europe & Central Asia (IDA & IBRD countries)European UnionFaroe IslandsFijiFinlandFragile and conflict affected situationsFranceFrench PolynesiaGabonGambia, TheGeorgiaGermanyGhanaGibraltarGreeceGreenlandGrenadaGuatemalaGuineaGuinea-BissauGuyanaHaitiHeavily indebted poor countries (HIPC)High incomeHondurasHong Kong SAR, ChinaHungaryIBRD onlyIcelandIDA & IBRD totalIDA blendIDA onlyIDA totalIndiaIndonesiaIran, Islamic Rep.IraqIrelandIsraelItalyJamaicaJapanJordanKazakhstanKenyaKiribatiKorea, Dem. People’s Rep.Korea, Rep.KuwaitKyrgyz RepublicLao PDRLate-demographic dividendLatin America & Caribbean Latin America & Caribbean (excluding high income)Latin America & the Caribbean (IDA & IBRD countries)LatviaLeast developed countries: UN classificationLebanonLesothoLiberiaLibyaLiechtensteinLithuaniaLow & middle incomeLow incomeLower middle incomeLuxembourgMacao SAR, ChinaMacedonia, FYRMadagascarMalawiMalaysiaMaldivesMaliMaltaMarshall IslandsMauritaniaMauritiusMexicoMicronesia, Fed. Sts.Middle East & North AfricaMiddle East & North Africa (excluding high income)Middle East & North Africa (IDA & IBRD countries)Middle incomeMoldovaMongoliaMontenegroMoroccoMozambiqueMyanmarNamibiaNauruNepalNetherlandsNew CaledoniaNew ZealandNicaraguaNigerNigeriaNorth AmericaNorwayOECD membersOmanOther small statesPacific island small statesPakistanPalauPanamaPapua New GuineaParaguayPeruPhilippinesPolandPortugalPost-demographic dividendPre-demographic dividendQatarRomaniaRussian FederationRwandaSamoaSao Tome and PrincipeSaudi ArabiaSenegalSerbiaSeychellesSierra LeoneSingaporeSint Maarten (Dutch part)Slovak RepublicSloveniaSmall statesSolomon IslandsSomaliaSouth AfricaSouth AsiaSouth Asia (IDA & IBRD)South SudanSpainSri LankaSt. Kitts and NevisSt. LuciaSt. Vincent and the GrenadinesSub-Saharan Africa Sub-Saharan Africa (excluding high income)Sub-Saharan Africa (IDA & IBRD countries)SudanSurinameSwazilandSwedenSwitzerlandSyrian Arab RepublicTajikistanTanzaniaThailandTimor-LesteTogoTongaTrinidad and TobagoTunisiaTurkeyTurkmenistanTurks and Caicos IslandsUgandaUkraineUnited Arab EmiratesUnited KingdomUnited StatesUpper middle incomeUruguayUzbekistanVanuatuVenezuela, RBVietnamWest Bank and GazaWorldYemen, Rep.ZambiaZimbabwe Timeline:
This timeline shows a graph from 1961 to 2014 of Luxembourg. No data until 1960. Number of actual observations by date: 54.
Source name:
World Development Indicators
Source organization:
Carbon Dioxide Information Analysis Center, Environmental Sciences Division, Oak Ridge National Laboratory, Tennessee, United States.
Categories, topics:
Climate Change, Environment
Last updated:
apr 23, 2017
Indicators value changes by year
At the date of observation
Value
Absolute change
Change from previous value
jan 1, 1961
36.685
+36.685
0.0%
jan 1, 1962
36.584
-0.101
-0.28%
jan 1, 1963
36.013
-0.571
-1.56%
jan 1, 1964
35.324
-0.689
-1.91%
jan 1, 1965
37.548
+2.225
6.3%
jan 1, 1966
36.814
-0.734
-1.96%
jan 1, 1967
34.804
-2.01
-5.46%
jan 1, 1968
33.912
-0.891
-2.56%
jan 1, 1969
36.534
+2.621
7.73%
jan 1, 1970
39.093
+2.559
7.01%
jan 1, 1971
40.533
+1.44
3.68%
jan 1, 1972
38.553
-1.98
-4.89%
jan 1, 1973
38.934
+0.382
0.99%
jan 1, 1974
40.432
+1.498
3.85%
jan 1, 1975
40.59
+0.158
0.39%
jan 1, 1976
32.997
-7.592
-18.7%
jan 1, 1977
32.824
-0.173
-0.52%
jan 1, 1978
30.241
-2.584
-7.87%
jan 1, 1979
32.729
+2.488
8.23%
jan 1, 1980
33.41
+0.681
2.08%
jan 1, 1981
30.281
-3.13
-9.37%
jan 1, 1982
25.814
-4.467
-14.75%
jan 1, 1983
24.238
-1.576
-6.11%
jan 1, 1984
22.677
-1.561
-6.44%
jan 1, 1985
24.397
+1.72
7.59%
jan 1, 1986
25.0
+0.603
2.47%
jan 1, 1987
24.46
-0.54
-2.16%
jan 1, 1988
23.382
-1.078
-4.41%
jan 1, 1989
23.91
+0.528
2.26%
jan 1, 1990
25.614
+1.704
7.13%
jan 1, 1991
26.198
+0.584
2.28%
jan 1, 1992
27.431
+1.234
4.71%
jan 1, 1993
26.957
-0.474
-1.73%
jan 1, 1994
27.142
+0.185
0.69%
jan 1, 1995
25.292
-1.851
-6.82%
jan 1, 1996
20.353
-4.939
-19.53%
jan 1, 1997
20.37
+0.017
0.08%
jan 1, 1998
18.927
-1.443
-7.08%
jan 1, 1999
17.32
-1.607
-8.49%
jan 1, 2000
17.855
+0.534
3.08%
jan 1, 2001
18.886
+1.031
5.77%
jan 1, 2002
19.933
+1.047
5.55%
jan 1, 2003
21.106
+1.173
5.88%
jan 1, 2004
21.931
+0.825
3.91%
jan 1, 2005
24.599
+2.668
12.17%
jan 1, 2006
24.825
+0.226
0.92%
jan 1, 2007
24.013
-0.812
-3.27%
jan 1, 2008
22.957
-1.056
-4.4%
jan 1, 2009
22.385
-0.572
-2.49%
jan 1, 2010
20.877
-1.508
-6.74%
jan 1, 2011
21.635
+0.758
3.63%
jan 1, 2012
21.103
-0.532
-2.46%
jan 1, 2013
20.084
-1.019
-4.83%
jan 1, 2014
18.701
-1.383
-6.89%
Ranking of countries by current statistics by years


Comments: