29
/
en
AIzaSyAYiBZKx7MnpbEhh9jyipgxe19OcubqV5w
April 1, 2024
35591
High income
HIC
false
2
1
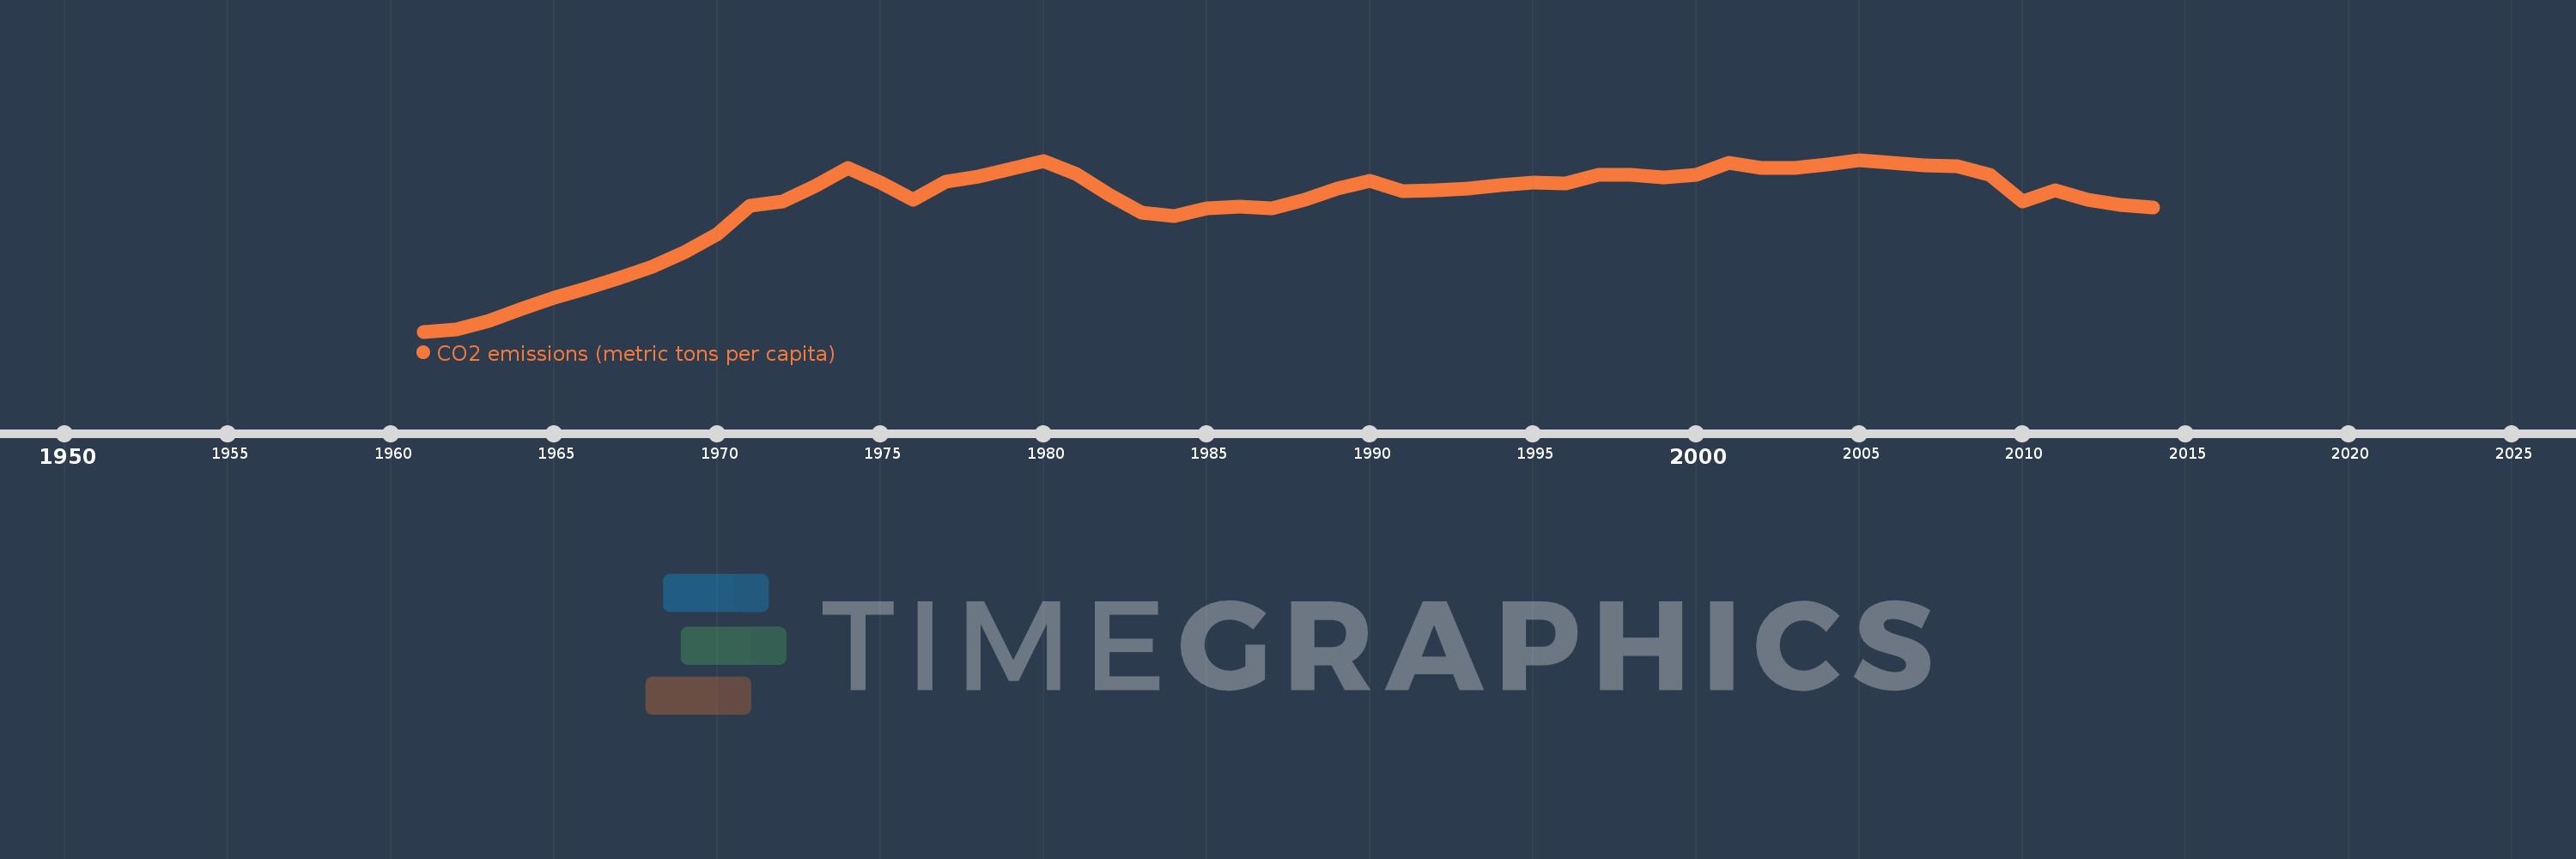
CO2 emissions (metric tons per capita)
2014,2013,2012,2011,2010,2009,2008,2007,2006,2005,2004,2003,2002,2001,2000,1999,1998,1997,1996,1995,1994,1993,1992,1991,1990,1989,1988,1987,1986,1985,1984,1983,1982,1981,1980,1979,1978,1977,1976,1975,1974,1973,1972,1971,1970,1969,1968,1967,1966,1965,1964,1963,1962,1961
This statistics in other country:
AfghanistanAlbaniaAlgeriaAndorraAngolaAntigua and BarbudaArab WorldArgentinaArmeniaArubaAustraliaAustriaAzerbaijanBahamas, TheBahrainBangladeshBarbadosBelarusBelgiumBelizeBeninBermudaBhutanBoliviaBosnia and HerzegovinaBotswanaBrazilBritish Virgin IslandsBrunei DarussalamBulgariaBurkina FasoBurundiCabo VerdeCambodiaCameroonCanadaCaribbean small statesCayman IslandsCentral African RepublicCentral Europe and the BalticsChadChileChinaColombiaComorosCongo, Dem. Rep.Congo, Rep.Costa RicaCote d'IvoireCroatiaCubaCuracaoCyprusCzech RepublicDenmarkDjiboutiDominicaDominican RepublicEarly-demographic dividendEast Asia & PacificEast Asia & Pacific (excluding high income)East Asia & Pacific (IDA & IBRD countries)EcuadorEgypt, Arab Rep.El SalvadorEquatorial GuineaEritreaEstoniaEthiopiaEuro areaEurope & Central AsiaEurope & Central Asia (excluding high income)Europe & Central Asia (IDA & IBRD countries)European UnionFaroe IslandsFijiFinlandFragile and conflict affected situationsFranceFrench PolynesiaGabonGambia, TheGeorgiaGermanyGhanaGibraltarGreeceGreenlandGrenadaGuatemalaGuineaGuinea-BissauGuyanaHaitiHeavily indebted poor countries (HIPC)High incomeHondurasHong Kong SAR, ChinaHungaryIBRD onlyIcelandIDA & IBRD totalIDA blendIDA onlyIDA totalIndiaIndonesiaIran, Islamic Rep.IraqIrelandIsraelItalyJamaicaJapanJordanKazakhstanKenyaKiribatiKorea, Dem. People’s Rep.Korea, Rep.KuwaitKyrgyz RepublicLao PDRLate-demographic dividendLatin America & Caribbean Latin America & Caribbean (excluding high income)Latin America & the Caribbean (IDA & IBRD countries)LatviaLeast developed countries: UN classificationLebanonLesothoLiberiaLibyaLiechtensteinLithuaniaLow & middle incomeLow incomeLower middle incomeLuxembourgMacao SAR, ChinaMacedonia, FYRMadagascarMalawiMalaysiaMaldivesMaliMaltaMarshall IslandsMauritaniaMauritiusMexicoMicronesia, Fed. Sts.Middle East & North AfricaMiddle East & North Africa (excluding high income)Middle East & North Africa (IDA & IBRD countries)Middle incomeMoldovaMongoliaMontenegroMoroccoMozambiqueMyanmarNamibiaNauruNepalNetherlandsNew CaledoniaNew ZealandNicaraguaNigerNigeriaNorth AmericaNorwayOECD membersOmanOther small statesPacific island small statesPakistanPalauPanamaPapua New GuineaParaguayPeruPhilippinesPolandPortugalPost-demographic dividendPre-demographic dividendQatarRomaniaRussian FederationRwandaSamoaSao Tome and PrincipeSaudi ArabiaSenegalSerbiaSeychellesSierra LeoneSingaporeSint Maarten (Dutch part)Slovak RepublicSloveniaSmall statesSolomon IslandsSomaliaSouth AfricaSouth AsiaSouth Asia (IDA & IBRD)South SudanSpainSri LankaSt. Kitts and NevisSt. LuciaSt. Vincent and the GrenadinesSub-Saharan Africa Sub-Saharan Africa (excluding high income)Sub-Saharan Africa (IDA & IBRD countries)SudanSurinameSwazilandSwedenSwitzerlandSyrian Arab RepublicTajikistanTanzaniaThailandTimor-LesteTogoTongaTrinidad and TobagoTunisiaTurkeyTurkmenistanTurks and Caicos IslandsUgandaUkraineUnited Arab EmiratesUnited KingdomUnited StatesUpper middle incomeUruguayUzbekistanVanuatuVenezuela, RBVietnamWest Bank and GazaWorldYemen, Rep.ZambiaZimbabwe Timeline:
This timeline shows a graph from 1961 to 2014 of High income. No data until 1960. Number of actual observations by date: 54.
Source name:
World Development Indicators
Source organization:
Carbon Dioxide Information Analysis Center, Environmental Sciences Division, Oak Ridge National Laboratory, Tennessee, United States.
Categories, topics:
Climate Change, Environment
Last updated:
apr 23, 2017
Indicators value changes by year
Maximum:
12.338
jan 1, 2005
At the date of observation
Value
Absolute change
Change from previous value
jan 1, 1961
7.529
+7.529
0.0%
jan 1, 1962
7.579
+0.051
0.68%
jan 1, 1963
7.83
+0.25
3.3%
jan 1, 1964
8.165
+0.335
4.28%
jan 1, 1965
8.476
+0.311
3.81%
jan 1, 1966
8.747
+0.271
3.19%
jan 1, 1967
9.032
+0.285
3.26%
jan 1, 1968
9.338
+0.306
3.38%
jan 1, 1969
9.747
+0.409
4.38%
jan 1, 1970
10.264
+0.517
5.3%
jan 1, 1971
11.052
+0.789
7.68%
jan 1, 1972
11.161
+0.109
0.98%
jan 1, 1973
11.603
+0.442
3.96%
jan 1, 1974
12.098
+0.495
4.27%
jan 1, 1975
11.695
-0.403
-3.33%
jan 1, 1976
11.209
-0.486
-4.15%
jan 1, 1977
11.725
+0.516
4.6%
jan 1, 1978
11.874
+0.15
1.28%
jan 1, 1979
12.082
+0.208
1.75%
jan 1, 1980
12.303
+0.221
1.83%
jan 1, 1981
11.948
-0.355
-2.89%
jan 1, 1982
11.371
-0.577
-4.83%
jan 1, 1983
10.861
-0.51
-4.48%
jan 1, 1984
10.757
-0.104
-0.95%
jan 1, 1985
10.974
+0.216
2.01%
jan 1, 1986
11.024
+0.05
0.46%
jan 1, 1987
10.986
-0.038
-0.35%
jan 1, 1988
11.211
+0.225
2.05%
jan 1, 1989
11.541
+0.33
2.94%
jan 1, 1990
11.753
+0.212
1.84%
jan 1, 1991
11.46
-0.293
-2.49%
jan 1, 1992
11.485
+0.025
0.22%
jan 1, 1993
11.541
+0.056
0.49%
jan 1, 1994
11.619
+0.078
0.68%
jan 1, 1995
11.693
+0.074
0.64%
jan 1, 1996
11.668
-0.025
-0.21%
jan 1, 1997
11.906
+0.238
2.04%
jan 1, 1998
11.917
+0.011
0.09%
jan 1, 1999
11.843
-0.074
-0.62%
jan 1, 2000
11.924
+0.081
0.69%
jan 1, 2001
12.243
+0.318
2.67%
jan 1, 2002
12.119
-0.124
-1.01%
jan 1, 2003
12.115
-0.003
-0.03%
jan 1, 2004
12.211
+0.096
0.79%
jan 1, 2005
12.338
+0.127
1.04%
jan 1, 2006
12.252
-0.087
-0.7%
jan 1, 2007
12.191
-0.061
-0.5%
jan 1, 2008
12.162
-0.028
-0.23%
jan 1, 2009
11.909
-0.253
-2.08%
jan 1, 2010
11.173
-0.736
-6.18%
jan 1, 2011
11.482
+0.309
2.77%
jan 1, 2012
11.224
-0.258
-2.25%
jan 1, 2013
11.071
-0.153
-1.36%
jan 1, 2014
10.994
-0.077
-0.7%
Ranking of countries by current statistics by years


Comments: