29
/
en
AIzaSyAYiBZKx7MnpbEhh9jyipgxe19OcubqV5w
April 1, 2024
206034
Nauru
NRU
true
2
1
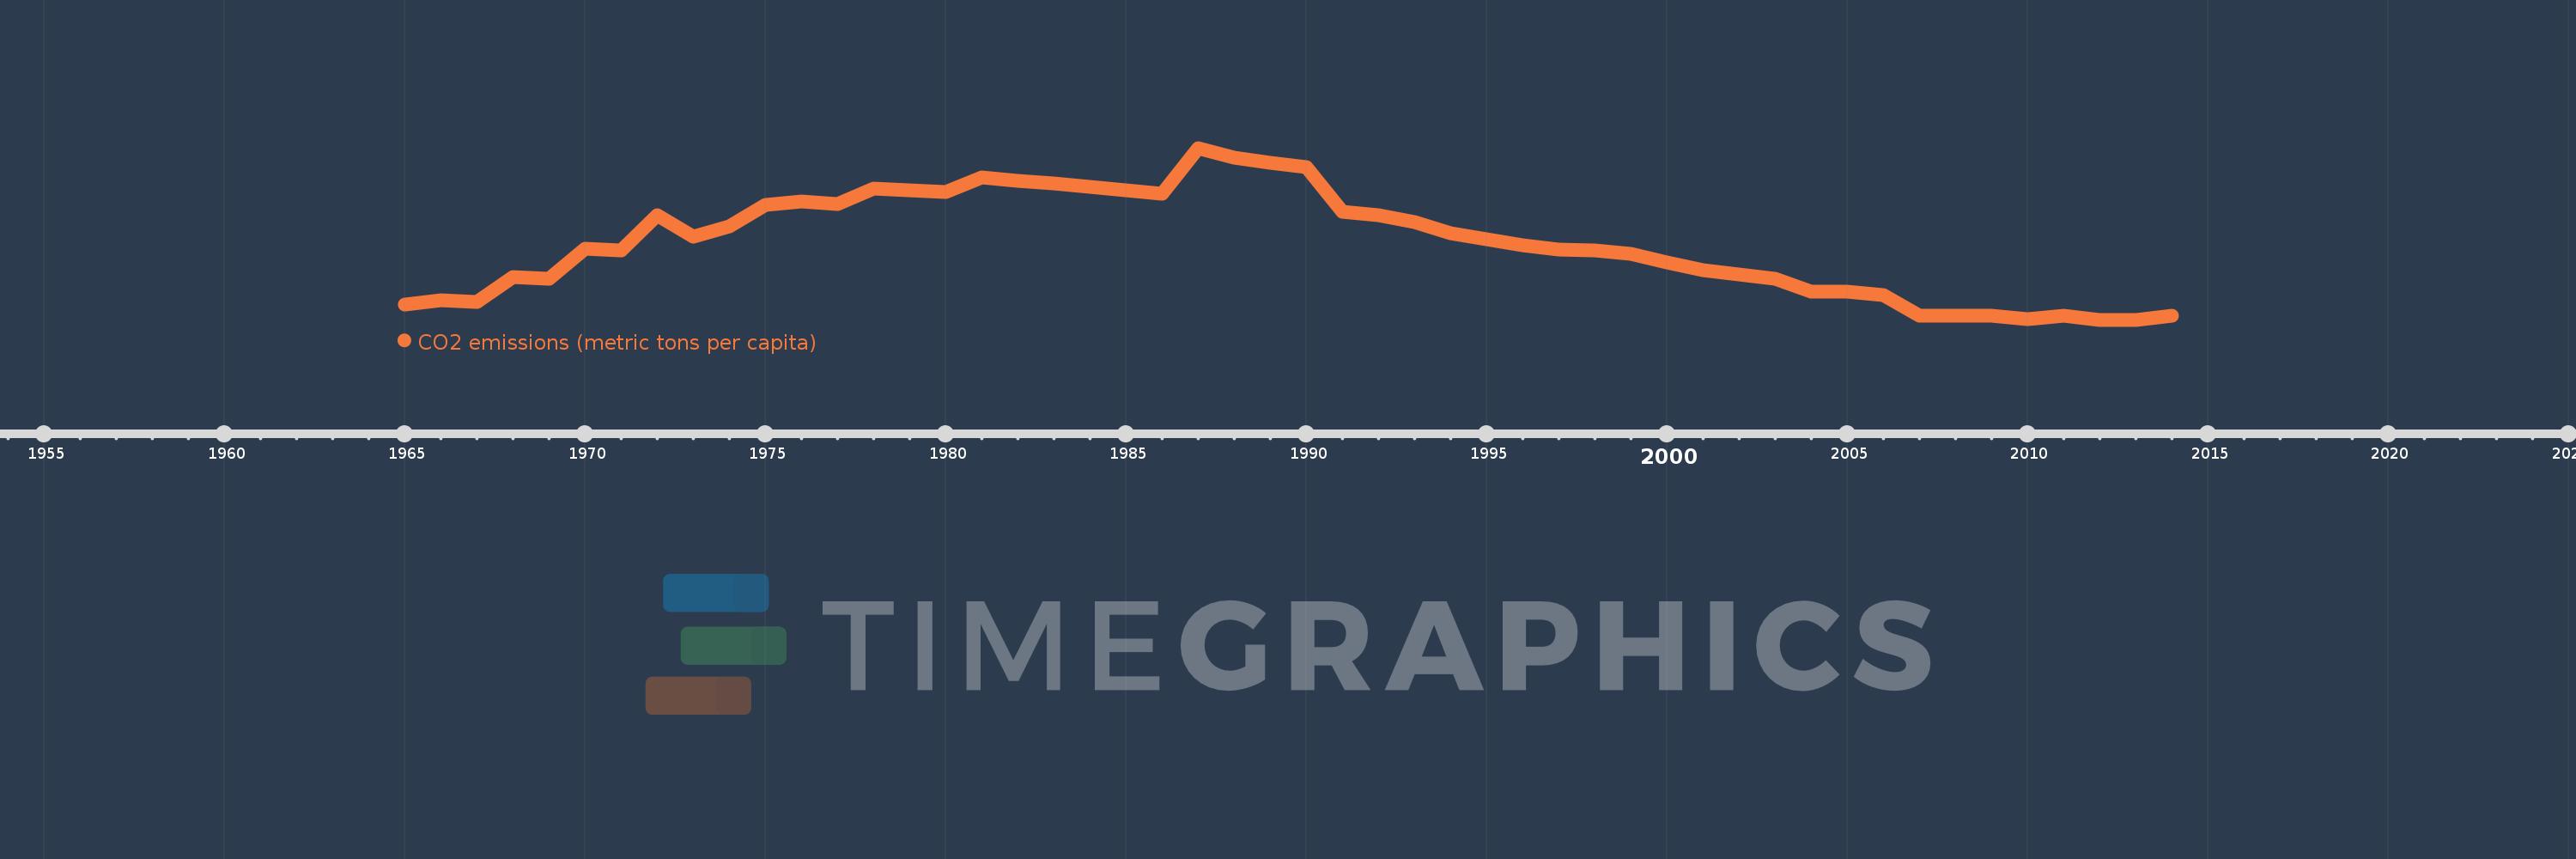
CO2 emissions (metric tons per capita)
2014,2013,2012,2011,2010,2009,2008,2007,2006,2005,2004,2003,2002,2001,2000,1999,1998,1997,1996,1995,1994,1993,1992,1991,1990,1989,1988,1987,1986,1985,1984,1983,1982,1981,1980,1979,1978,1977,1976,1975,1974,1973,1972,1971,1970,1969,1968,1967,1966,1965
This statistics in other country:
AfghanistanAlbaniaAlgeriaAndorraAngolaAntigua and BarbudaArab WorldArgentinaArmeniaArubaAustraliaAustriaAzerbaijanBahamas, TheBahrainBangladeshBarbadosBelarusBelgiumBelizeBeninBermudaBhutanBoliviaBosnia and HerzegovinaBotswanaBrazilBritish Virgin IslandsBrunei DarussalamBulgariaBurkina FasoBurundiCabo VerdeCambodiaCameroonCanadaCaribbean small statesCayman IslandsCentral African RepublicCentral Europe and the BalticsChadChileChinaColombiaComorosCongo, Dem. Rep.Congo, Rep.Costa RicaCote d'IvoireCroatiaCubaCuracaoCyprusCzech RepublicDenmarkDjiboutiDominicaDominican RepublicEarly-demographic dividendEast Asia & PacificEast Asia & Pacific (excluding high income)East Asia & Pacific (IDA & IBRD countries)EcuadorEgypt, Arab Rep.El SalvadorEquatorial GuineaEritreaEstoniaEthiopiaEuro areaEurope & Central AsiaEurope & Central Asia (excluding high income)Europe & Central Asia (IDA & IBRD countries)European UnionFaroe IslandsFijiFinlandFragile and conflict affected situationsFranceFrench PolynesiaGabonGambia, TheGeorgiaGermanyGhanaGibraltarGreeceGreenlandGrenadaGuatemalaGuineaGuinea-BissauGuyanaHaitiHeavily indebted poor countries (HIPC)High incomeHondurasHong Kong SAR, ChinaHungaryIBRD onlyIcelandIDA & IBRD totalIDA blendIDA onlyIDA totalIndiaIndonesiaIran, Islamic Rep.IraqIrelandIsraelItalyJamaicaJapanJordanKazakhstanKenyaKiribatiKorea, Dem. People’s Rep.Korea, Rep.KuwaitKyrgyz RepublicLao PDRLate-demographic dividendLatin America & Caribbean Latin America & Caribbean (excluding high income)Latin America & the Caribbean (IDA & IBRD countries)LatviaLeast developed countries: UN classificationLebanonLesothoLiberiaLibyaLiechtensteinLithuaniaLow & middle incomeLow incomeLower middle incomeLuxembourgMacao SAR, ChinaMacedonia, FYRMadagascarMalawiMalaysiaMaldivesMaliMaltaMarshall IslandsMauritaniaMauritiusMexicoMicronesia, Fed. Sts.Middle East & North AfricaMiddle East & North Africa (excluding high income)Middle East & North Africa (IDA & IBRD countries)Middle incomeMoldovaMongoliaMontenegroMoroccoMozambiqueMyanmarNamibiaNauruNepalNetherlandsNew CaledoniaNew ZealandNicaraguaNigerNigeriaNorth AmericaNorwayOECD membersOmanOther small statesPacific island small statesPakistanPalauPanamaPapua New GuineaParaguayPeruPhilippinesPolandPortugalPost-demographic dividendPre-demographic dividendQatarRomaniaRussian FederationRwandaSamoaSao Tome and PrincipeSaudi ArabiaSenegalSerbiaSeychellesSierra LeoneSingaporeSint Maarten (Dutch part)Slovak RepublicSloveniaSmall statesSolomon IslandsSomaliaSouth AfricaSouth AsiaSouth Asia (IDA & IBRD)South SudanSpainSri LankaSt. Kitts and NevisSt. LuciaSt. Vincent and the GrenadinesSub-Saharan Africa Sub-Saharan Africa (excluding high income)Sub-Saharan Africa (IDA & IBRD countries)SudanSurinameSwazilandSwedenSwitzerlandSyrian Arab RepublicTajikistanTanzaniaThailandTimor-LesteTogoTongaTrinidad and TobagoTunisiaTurkeyTurkmenistanTurks and Caicos IslandsUgandaUkraineUnited Arab EmiratesUnited KingdomUnited StatesUpper middle incomeUruguayUzbekistanVanuatuVenezuela, RBVietnamWest Bank and GazaWorldYemen, Rep.ZambiaZimbabwe Timeline:
This timeline shows a graph from 1965 to 2014 of Nauru. No data until 1964. Number of actual observations by date: 50.
Source name:
World Development Indicators
Source organization:
Carbon Dioxide Information Analysis Center, Environmental Sciences Division, Oak Ridge National Laboratory, Tennessee, United States.
Categories, topics:
Climate Change, Environment
Last updated:
apr 23, 2017
Indicators value changes by year
Maximum:
19.309
jan 1, 1987
At the date of observation
Value
Absolute change
Change from previous value
jan 1, 1965
5.334
+5.334
0.0%
jan 1, 1966
5.752
+0.418
7.83%
jan 1, 1967
5.56
-0.192
-3.34%
jan 1, 1968
7.812
+2.253
40.51%
jan 1, 1969
7.638
-0.174
-2.23%
jan 1, 1970
10.365
+2.727
35.7%
jan 1, 1971
10.166
-0.2
-1.93%
jan 1, 1972
13.296
+3.131
30.8%
jan 1, 1973
11.42
-1.876
-14.11%
jan 1, 1974
12.291
+0.871
7.62%
jan 1, 1975
14.201
+1.91
15.54%
jan 1, 1976
14.523
+0.322
2.27%
jan 1, 1977
14.348
-0.175
-1.2%
jan 1, 1978
15.712
+1.364
9.51%
jan 1, 1979
15.549
-0.163
-1.04%
jan 1, 1980
15.376
-0.172
-1.11%
jan 1, 1981
16.65
+1.274
8.29%
jan 1, 1982
16.411
-0.239
-1.43%
jan 1, 1983
16.152
-0.259
-1.58%
jan 1, 1984
15.872
-0.28
-1.73%
jan 1, 1985
15.571
-0.301
-1.9%
jan 1, 1986
15.253
-0.318
-2.04%
jan 1, 1987
19.309
+4.056
26.59%
jan 1, 1988
18.442
-0.867
-4.49%
jan 1, 1989
18.017
-0.426
-2.31%
jan 1, 1990
17.606
-0.41
-2.28%
jan 1, 1991
13.616
-3.991
-22.67%
jan 1, 1992
13.329
-0.287
-2.11%
jan 1, 1993
12.679
-0.65
-4.87%
jan 1, 1994
11.696
-0.983
-7.75%
jan 1, 1995
11.154
-0.543
-4.64%
jan 1, 1996
10.666
-0.488
-4.37%
jan 1, 1997
10.234
-0.432
-4.05%
jan 1, 1998
10.21
-0.023
-0.23%
jan 1, 1999
9.848
-0.363
-3.55%
jan 1, 2000
9.127
-0.72
-7.32%
jan 1, 2001
8.399
-0.729
-7.98%
jan 1, 2002
8.025
-0.374
-4.45%
jan 1, 2003
7.645
-0.38
-4.73%
jan 1, 2004
6.538
-1.107
-14.48%
jan 1, 2005
6.527
-0.011
-0.17%
jan 1, 2006
6.163
-0.364
-5.57%
jan 1, 2007
4.356
-1.807
-29.31%
jan 1, 2008
4.368
+0.011
0.26%
jan 1, 2009
4.38
+0.012
0.28%
jan 1, 2010
4.022
-0.357
-8.16%
jan 1, 2011
4.389
+0.367
9.12%
jan 1, 2012
4.016
-0.373
-8.5%
jan 1, 2013
4.002
-0.014
-0.36%
jan 1, 2014
4.346
+0.344
8.6%
Ranking of countries by current statistics by years


Comments: