29
/
en
AIzaSyAYiBZKx7MnpbEhh9jyipgxe19OcubqV5w
April 1, 2024
153357
Iceland
ISL
true
2
1
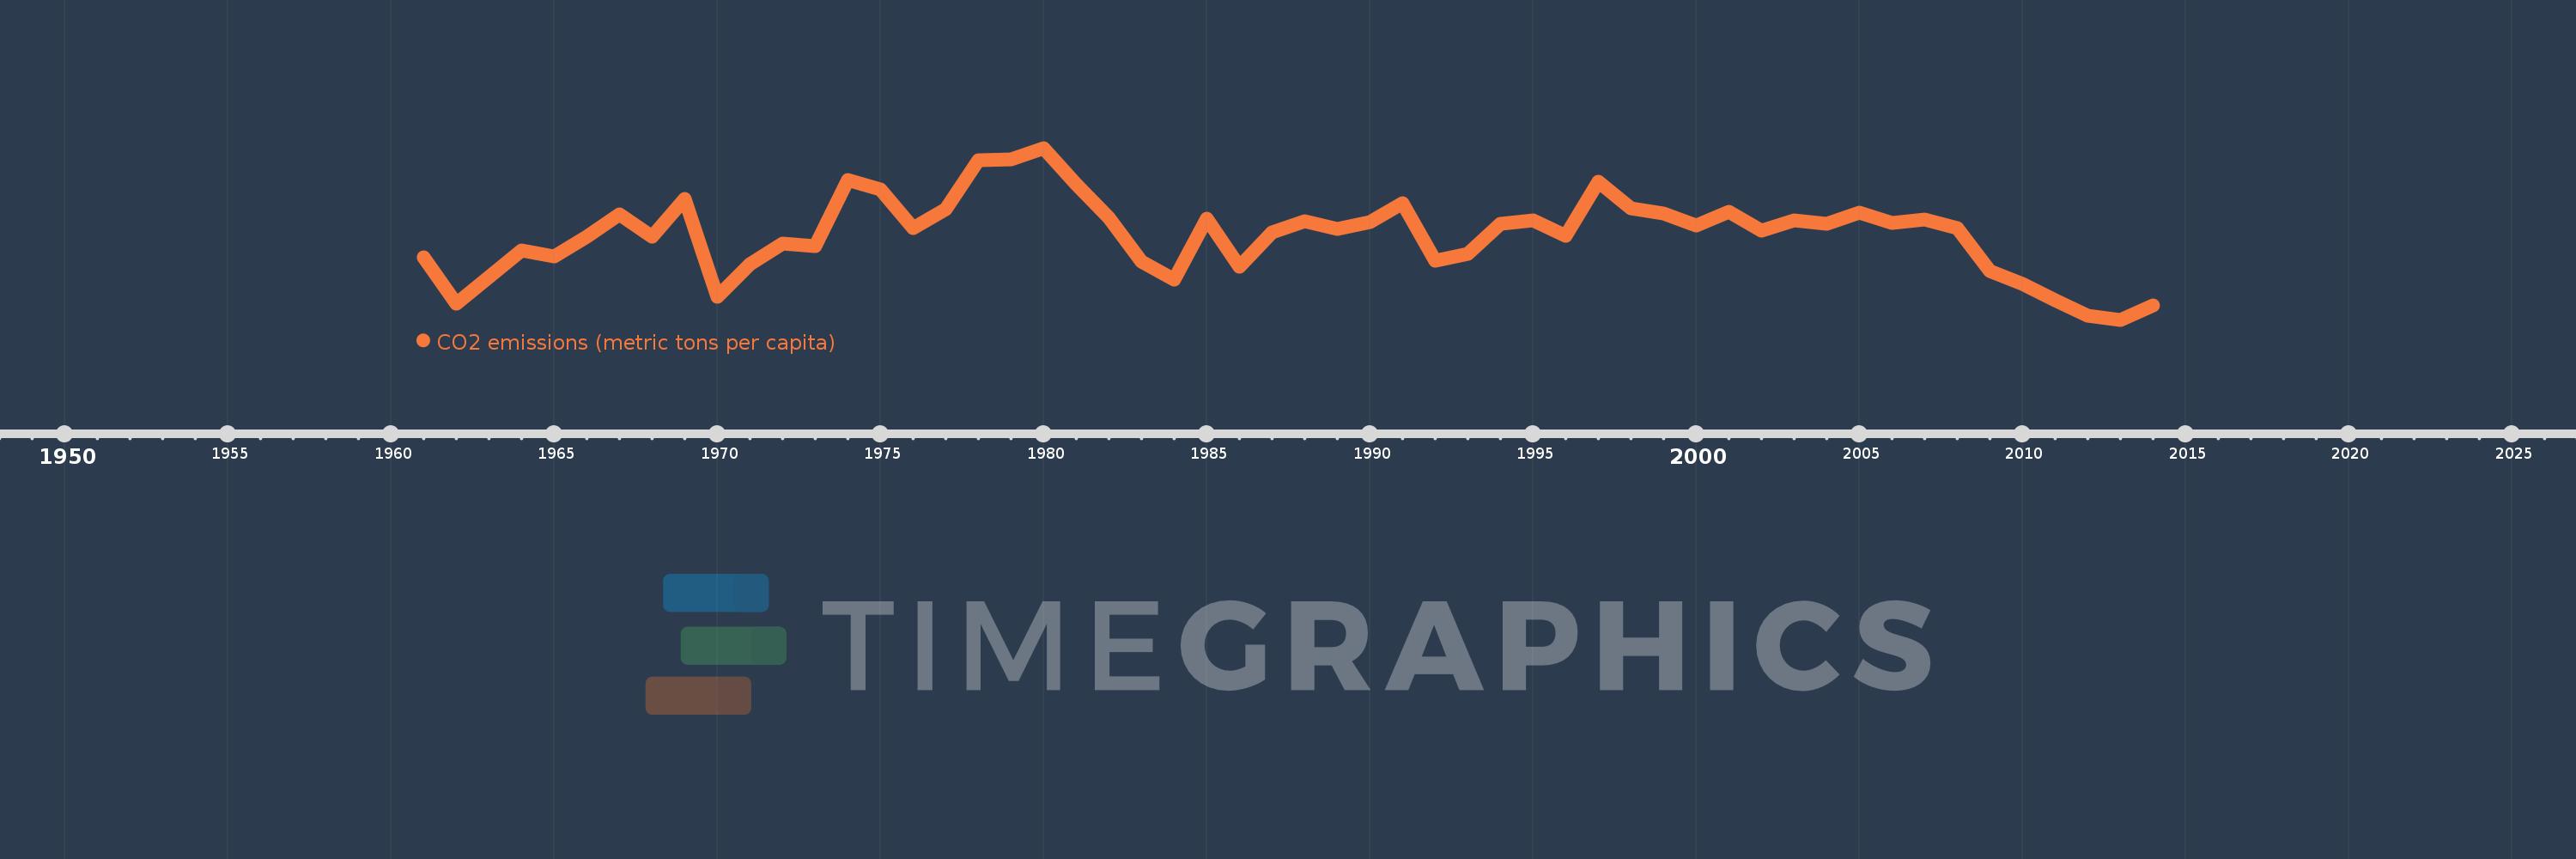
CO2 emissions (metric tons per capita)
2014,2013,2012,2011,2010,2009,2008,2007,2006,2005,2004,2003,2002,2001,2000,1999,1998,1997,1996,1995,1994,1993,1992,1991,1990,1989,1988,1987,1986,1985,1984,1983,1982,1981,1980,1979,1978,1977,1976,1975,1974,1973,1972,1971,1970,1969,1968,1967,1966,1965,1964,1963,1962,1961
This statistics in other country:
AfghanistanAlbaniaAlgeriaAndorraAngolaAntigua and BarbudaArab WorldArgentinaArmeniaArubaAustraliaAustriaAzerbaijanBahamas, TheBahrainBangladeshBarbadosBelarusBelgiumBelizeBeninBermudaBhutanBoliviaBosnia and HerzegovinaBotswanaBrazilBritish Virgin IslandsBrunei DarussalamBulgariaBurkina FasoBurundiCabo VerdeCambodiaCameroonCanadaCaribbean small statesCayman IslandsCentral African RepublicCentral Europe and the BalticsChadChileChinaColombiaComorosCongo, Dem. Rep.Congo, Rep.Costa RicaCote d'IvoireCroatiaCubaCuracaoCyprusCzech RepublicDenmarkDjiboutiDominicaDominican RepublicEarly-demographic dividendEast Asia & PacificEast Asia & Pacific (excluding high income)East Asia & Pacific (IDA & IBRD countries)EcuadorEgypt, Arab Rep.El SalvadorEquatorial GuineaEritreaEstoniaEthiopiaEuro areaEurope & Central AsiaEurope & Central Asia (excluding high income)Europe & Central Asia (IDA & IBRD countries)European UnionFaroe IslandsFijiFinlandFragile and conflict affected situationsFranceFrench PolynesiaGabonGambia, TheGeorgiaGermanyGhanaGibraltarGreeceGreenlandGrenadaGuatemalaGuineaGuinea-BissauGuyanaHaitiHeavily indebted poor countries (HIPC)High incomeHondurasHong Kong SAR, ChinaHungaryIBRD onlyIcelandIDA & IBRD totalIDA blendIDA onlyIDA totalIndiaIndonesiaIran, Islamic Rep.IraqIrelandIsraelItalyJamaicaJapanJordanKazakhstanKenyaKiribatiKorea, Dem. People’s Rep.Korea, Rep.KuwaitKyrgyz RepublicLao PDRLate-demographic dividendLatin America & Caribbean Latin America & Caribbean (excluding high income)Latin America & the Caribbean (IDA & IBRD countries)LatviaLeast developed countries: UN classificationLebanonLesothoLiberiaLibyaLiechtensteinLithuaniaLow & middle incomeLow incomeLower middle incomeLuxembourgMacao SAR, ChinaMacedonia, FYRMadagascarMalawiMalaysiaMaldivesMaliMaltaMarshall IslandsMauritaniaMauritiusMexicoMicronesia, Fed. Sts.Middle East & North AfricaMiddle East & North Africa (excluding high income)Middle East & North Africa (IDA & IBRD countries)Middle incomeMoldovaMongoliaMontenegroMoroccoMozambiqueMyanmarNamibiaNauruNepalNetherlandsNew CaledoniaNew ZealandNicaraguaNigerNigeriaNorth AmericaNorwayOECD membersOmanOther small statesPacific island small statesPakistanPalauPanamaPapua New GuineaParaguayPeruPhilippinesPolandPortugalPost-demographic dividendPre-demographic dividendQatarRomaniaRussian FederationRwandaSamoaSao Tome and PrincipeSaudi ArabiaSenegalSerbiaSeychellesSierra LeoneSingaporeSint Maarten (Dutch part)Slovak RepublicSloveniaSmall statesSolomon IslandsSomaliaSouth AfricaSouth AsiaSouth Asia (IDA & IBRD)South SudanSpainSri LankaSt. Kitts and NevisSt. LuciaSt. Vincent and the GrenadinesSub-Saharan Africa Sub-Saharan Africa (excluding high income)Sub-Saharan Africa (IDA & IBRD countries)SudanSurinameSwazilandSwedenSwitzerlandSyrian Arab RepublicTajikistanTanzaniaThailandTimor-LesteTogoTongaTrinidad and TobagoTunisiaTurkeyTurkmenistanTurks and Caicos IslandsUgandaUkraineUnited Arab EmiratesUnited KingdomUnited StatesUpper middle incomeUruguayUzbekistanVanuatuVenezuela, RBVietnamWest Bank and GazaWorldYemen, Rep.ZambiaZimbabwe Timeline:
This timeline shows a graph from 1961 to 2014 of Iceland. No data until 1960. Number of actual observations by date: 54.
Source name:
World Development Indicators
Source organization:
Carbon Dioxide Information Analysis Center, Environmental Sciences Division, Oak Ridge National Laboratory, Tennessee, United States.
Categories, topics:
Climate Change, Environment
Last updated:
apr 23, 2017
Indicators value changes by year
At the date of observation
Value
Absolute change
Change from previous value
jan 1, 1961
6.913
+6.913
0.0%
jan 1, 1962
6.104
-0.809
-11.71%
jan 1, 1963
6.575
+0.471
7.72%
jan 1, 1964
7.032
+0.457
6.95%
jan 1, 1965
6.927
-0.104
-1.49%
jan 1, 1966
7.266
+0.339
4.89%
jan 1, 1967
7.65
+0.384
5.29%
jan 1, 1968
7.269
-0.381
-4.98%
jan 1, 1969
7.917
+0.647
8.91%
jan 1, 1970
6.221
-1.696
-21.42%
jan 1, 1971
6.798
+0.577
9.28%
jan 1, 1972
7.153
+0.354
5.21%
jan 1, 1973
7.101
-0.051
-0.72%
jan 1, 1974
8.256
+1.154
16.26%
jan 1, 1975
8.094
-0.162
-1.96%
jan 1, 1976
7.419
-0.675
-8.34%
jan 1, 1977
7.745
+0.326
4.4%
jan 1, 1978
8.597
+0.852
11.0%
jan 1, 1979
8.612
+0.015
0.18%
jan 1, 1980
8.805
+0.192
2.23%
jan 1, 1981
8.181
-0.623
-7.08%
jan 1, 1982
7.596
-0.585
-7.16%
jan 1, 1983
6.837
-0.759
-10.0%
jan 1, 1984
6.53
-0.307
-4.48%
jan 1, 1985
7.579
+1.049
16.06%
jan 1, 1986
6.744
-0.834
-11.01%
jan 1, 1987
7.344
+0.599
8.88%
jan 1, 1988
7.532
+0.188
2.57%
jan 1, 1989
7.4
-0.132
-1.75%
jan 1, 1990
7.527
+0.126
1.71%
jan 1, 1991
7.843
+0.316
4.2%
jan 1, 1992
6.856
-0.987
-12.58%
jan 1, 1993
6.967
+0.111
1.62%
jan 1, 1994
7.495
+0.527
7.57%
jan 1, 1995
7.554
+0.059
0.79%
jan 1, 1996
7.28
-0.274
-3.63%
jan 1, 1997
8.223
+0.943
12.95%
jan 1, 1998
7.763
-0.459
-5.59%
jan 1, 1999
7.667
-0.096
-1.24%
jan 1, 2000
7.456
-0.211
-2.75%
jan 1, 2001
7.694
+0.238
3.19%
jan 1, 2002
7.373
-0.32
-4.16%
jan 1, 2003
7.55
+0.177
2.4%
jan 1, 2004
7.485
-0.065
-0.86%
jan 1, 2005
7.684
+0.198
2.65%
jan 1, 2006
7.514
-0.17
-2.21%
jan 1, 2007
7.569
+0.055
0.73%
jan 1, 2008
7.415
-0.154
-2.03%
jan 1, 2009
6.677
-0.737
-9.94%
jan 1, 2010
6.447
-0.23
-3.44%
jan 1, 2011
6.169
-0.279
-4.33%
jan 1, 2012
5.897
-0.272
-4.4%
jan 1, 2013
5.831
-0.066
-1.11%
jan 1, 2014
6.082
+0.251
4.3%
Ranking of countries by current statistics by years


Comments: