29
/
en
AIzaSyAYiBZKx7MnpbEhh9jyipgxe19OcubqV5w
April 1, 2024
82545
Belize
BLZ
true
2
1
CO2 emissions (metric tons per capita)
2014,2013,2012,2011,2010,2009,2008,2007,2006,2005,2004,2003,2002,2001,2000,1999,1998,1997,1996,1995,1994,1993,1992,1991,1990,1989,1988,1987,1986,1985,1984,1983,1982,1981,1980,1979,1978,1977,1976,1975,1974,1973,1972,1971,1970,1969,1968,1967,1966,1965,1964,1963,1962,1961
This statistics in other country:
AfghanistanAlbaniaAlgeriaAndorraAngolaAntigua and BarbudaArab WorldArgentinaArmeniaArubaAustraliaAustriaAzerbaijanBahamas, TheBahrainBangladeshBarbadosBelarusBelgiumBelizeBeninBermudaBhutanBoliviaBosnia and HerzegovinaBotswanaBrazilBritish Virgin IslandsBrunei DarussalamBulgariaBurkina FasoBurundiCabo VerdeCambodiaCameroonCanadaCaribbean small statesCayman IslandsCentral African RepublicCentral Europe and the BalticsChadChileChinaColombiaComorosCongo, Dem. Rep.Congo, Rep.Costa RicaCote d'IvoireCroatiaCubaCuracaoCyprusCzech RepublicDenmarkDjiboutiDominicaDominican RepublicEarly-demographic dividendEast Asia & PacificEast Asia & Pacific (excluding high income)East Asia & Pacific (IDA & IBRD countries)EcuadorEgypt, Arab Rep.El SalvadorEquatorial GuineaEritreaEstoniaEthiopiaEuro areaEurope & Central AsiaEurope & Central Asia (excluding high income)Europe & Central Asia (IDA & IBRD countries)European UnionFaroe IslandsFijiFinlandFragile and conflict affected situationsFranceFrench PolynesiaGabonGambia, TheGeorgiaGermanyGhanaGibraltarGreeceGreenlandGrenadaGuatemalaGuineaGuinea-BissauGuyanaHaitiHeavily indebted poor countries (HIPC)High incomeHondurasHong Kong SAR, ChinaHungaryIBRD onlyIcelandIDA & IBRD totalIDA blendIDA onlyIDA totalIndiaIndonesiaIran, Islamic Rep.IraqIrelandIsraelItalyJamaicaJapanJordanKazakhstanKenyaKiribatiKorea, Dem. People’s Rep.Korea, Rep.KuwaitKyrgyz RepublicLao PDRLate-demographic dividendLatin America & Caribbean Latin America & Caribbean (excluding high income)Latin America & the Caribbean (IDA & IBRD countries)LatviaLeast developed countries: UN classificationLebanonLesothoLiberiaLibyaLiechtensteinLithuaniaLow & middle incomeLow incomeLower middle incomeLuxembourgMacao SAR, ChinaMacedonia, FYRMadagascarMalawiMalaysiaMaldivesMaliMaltaMarshall IslandsMauritaniaMauritiusMexicoMicronesia, Fed. Sts.Middle East & North AfricaMiddle East & North Africa (excluding high income)Middle East & North Africa (IDA & IBRD countries)Middle incomeMoldovaMongoliaMontenegroMoroccoMozambiqueMyanmarNamibiaNauruNepalNetherlandsNew CaledoniaNew ZealandNicaraguaNigerNigeriaNorth AmericaNorwayOECD membersOmanOther small statesPacific island small statesPakistanPalauPanamaPapua New GuineaParaguayPeruPhilippinesPolandPortugalPost-demographic dividendPre-demographic dividendQatarRomaniaRussian FederationRwandaSamoaSao Tome and PrincipeSaudi ArabiaSenegalSerbiaSeychellesSierra LeoneSingaporeSint Maarten (Dutch part)Slovak RepublicSloveniaSmall statesSolomon IslandsSomaliaSouth AfricaSouth AsiaSouth Asia (IDA & IBRD)South SudanSpainSri LankaSt. Kitts and NevisSt. LuciaSt. Vincent and the GrenadinesSub-Saharan Africa Sub-Saharan Africa (excluding high income)Sub-Saharan Africa (IDA & IBRD countries)SudanSurinameSwazilandSwedenSwitzerlandSyrian Arab RepublicTajikistanTanzaniaThailandTimor-LesteTogoTongaTrinidad and TobagoTunisiaTurkeyTurkmenistanTurks and Caicos IslandsUgandaUkraineUnited Arab EmiratesUnited KingdomUnited StatesUpper middle incomeUruguayUzbekistanVanuatuVenezuela, RBVietnamWest Bank and GazaWorldYemen, Rep.ZambiaZimbabwe Timeline:
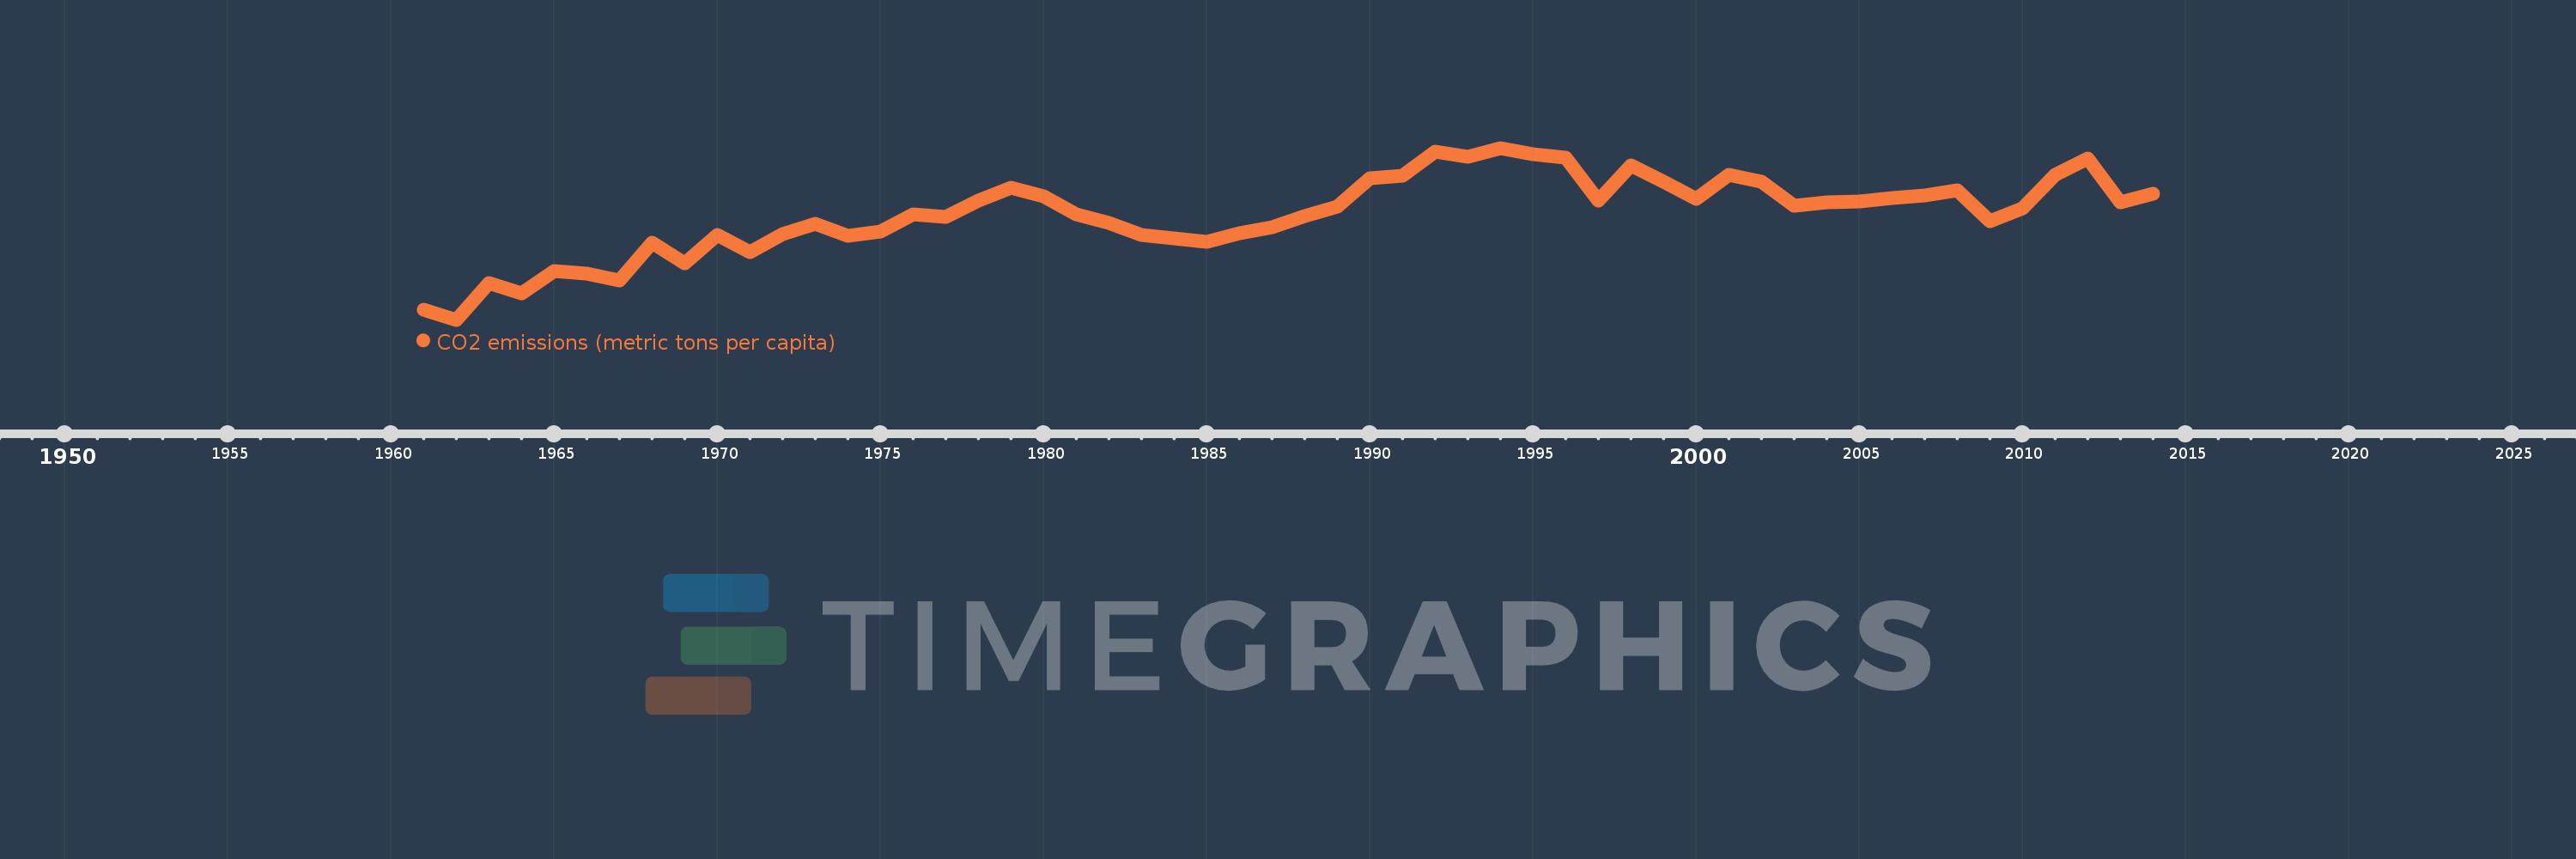
This timeline shows a graph from 1961 to 2014 of Belize. No data until 1960. Number of actual observations by date: 54.
Source name:
World Development Indicators
Source organization:
Carbon Dioxide Information Analysis Center, Environmental Sciences Division, Oak Ridge National Laboratory, Tennessee, United States.
Categories, topics:
Climate Change, Environment
Last updated:
apr 23, 2017
Indicators value changes by year
At the date of observation
Value
Absolute change
Change from previous value
jan 1, 1961
0.478
+0.478
0.0%
jan 1, 1962
0.387
-0.091
-18.98%
jan 1, 1963
0.715
+0.328
84.76%
jan 1, 1964
0.622
-0.093
-13.01%
jan 1, 1965
0.818
+0.196
31.48%
jan 1, 1966
0.795
-0.024
-2.88%
jan 1, 1967
0.738
-0.057
-7.17%
jan 1, 1968
1.074
+0.336
45.53%
jan 1, 1969
0.885
-0.189
-17.61%
jan 1, 1970
1.138
+0.253
28.6%
jan 1, 1971
0.99
-0.147
-12.94%
jan 1, 1972
1.146
+0.156
15.71%
jan 1, 1973
1.24
+0.094
8.21%
jan 1, 1974
1.134
-0.106
-8.52%
jan 1, 1975
1.173
+0.038
3.39%
jan 1, 1976
1.321
+0.148
12.61%
jan 1, 1977
1.302
-0.018
-1.39%
jan 1, 1978
1.445
+0.143
10.98%
jan 1, 1979
1.557
+0.111
7.7%
jan 1, 1980
1.479
-0.078
-4.99%
jan 1, 1981
1.323
-0.156
-10.57%
jan 1, 1982
1.242
-0.08
-6.07%
jan 1, 1983
1.138
-0.105
-8.44%
jan 1, 1984
1.106
-0.032
-2.77%
jan 1, 1985
1.075
-0.031
-2.82%
jan 1, 1986
1.156
+0.081
7.57%
jan 1, 1987
1.211
+0.055
4.74%
jan 1, 1988
1.304
+0.093
7.69%
jan 1, 1989
1.393
+0.089
6.8%
jan 1, 1990
1.639
+0.246
17.67%
jan 1, 1991
1.662
+0.023
1.4%
jan 1, 1992
1.88
+0.218
13.14%
jan 1, 1993
1.83
-0.05
-2.65%
jan 1, 1994
1.911
+0.081
4.42%
jan 1, 1995
1.855
-0.057
-2.97%
jan 1, 1996
1.825
-0.03
-1.6%
jan 1, 1997
1.442
-0.383
-21.01%
jan 1, 1998
1.754
+0.312
21.67%
jan 1, 1999
1.608
-0.146
-8.31%
jan 1, 2000
1.457
-0.151
-9.38%
jan 1, 2001
1.675
+0.218
14.96%
jan 1, 2002
1.611
-0.065
-3.87%
jan 1, 2003
1.399
-0.212
-13.17%
jan 1, 2004
1.431
+0.032
2.3%
jan 1, 2005
1.434
+0.004
0.27%
jan 1, 2006
1.463
+0.028
1.97%
jan 1, 2007
1.488
+0.025
1.74%
jan 1, 2008
1.536
+0.048
3.22%
jan 1, 2009
1.258
-0.278
-18.13%
jan 1, 2010
1.378
+0.121
9.6%
jan 1, 2011
1.676
+0.298
21.6%
jan 1, 2012
1.816
+0.14
8.33%
jan 1, 2013
1.427
-0.389
-21.43%
jan 1, 2014
1.502
+0.076
5.29%
Ranking of countries by current statistics by years


Comments: