29
/
en
AIzaSyAYiBZKx7MnpbEhh9jyipgxe19OcubqV5w
April 1, 2024
53265
Other small states
OSS
false
2
1
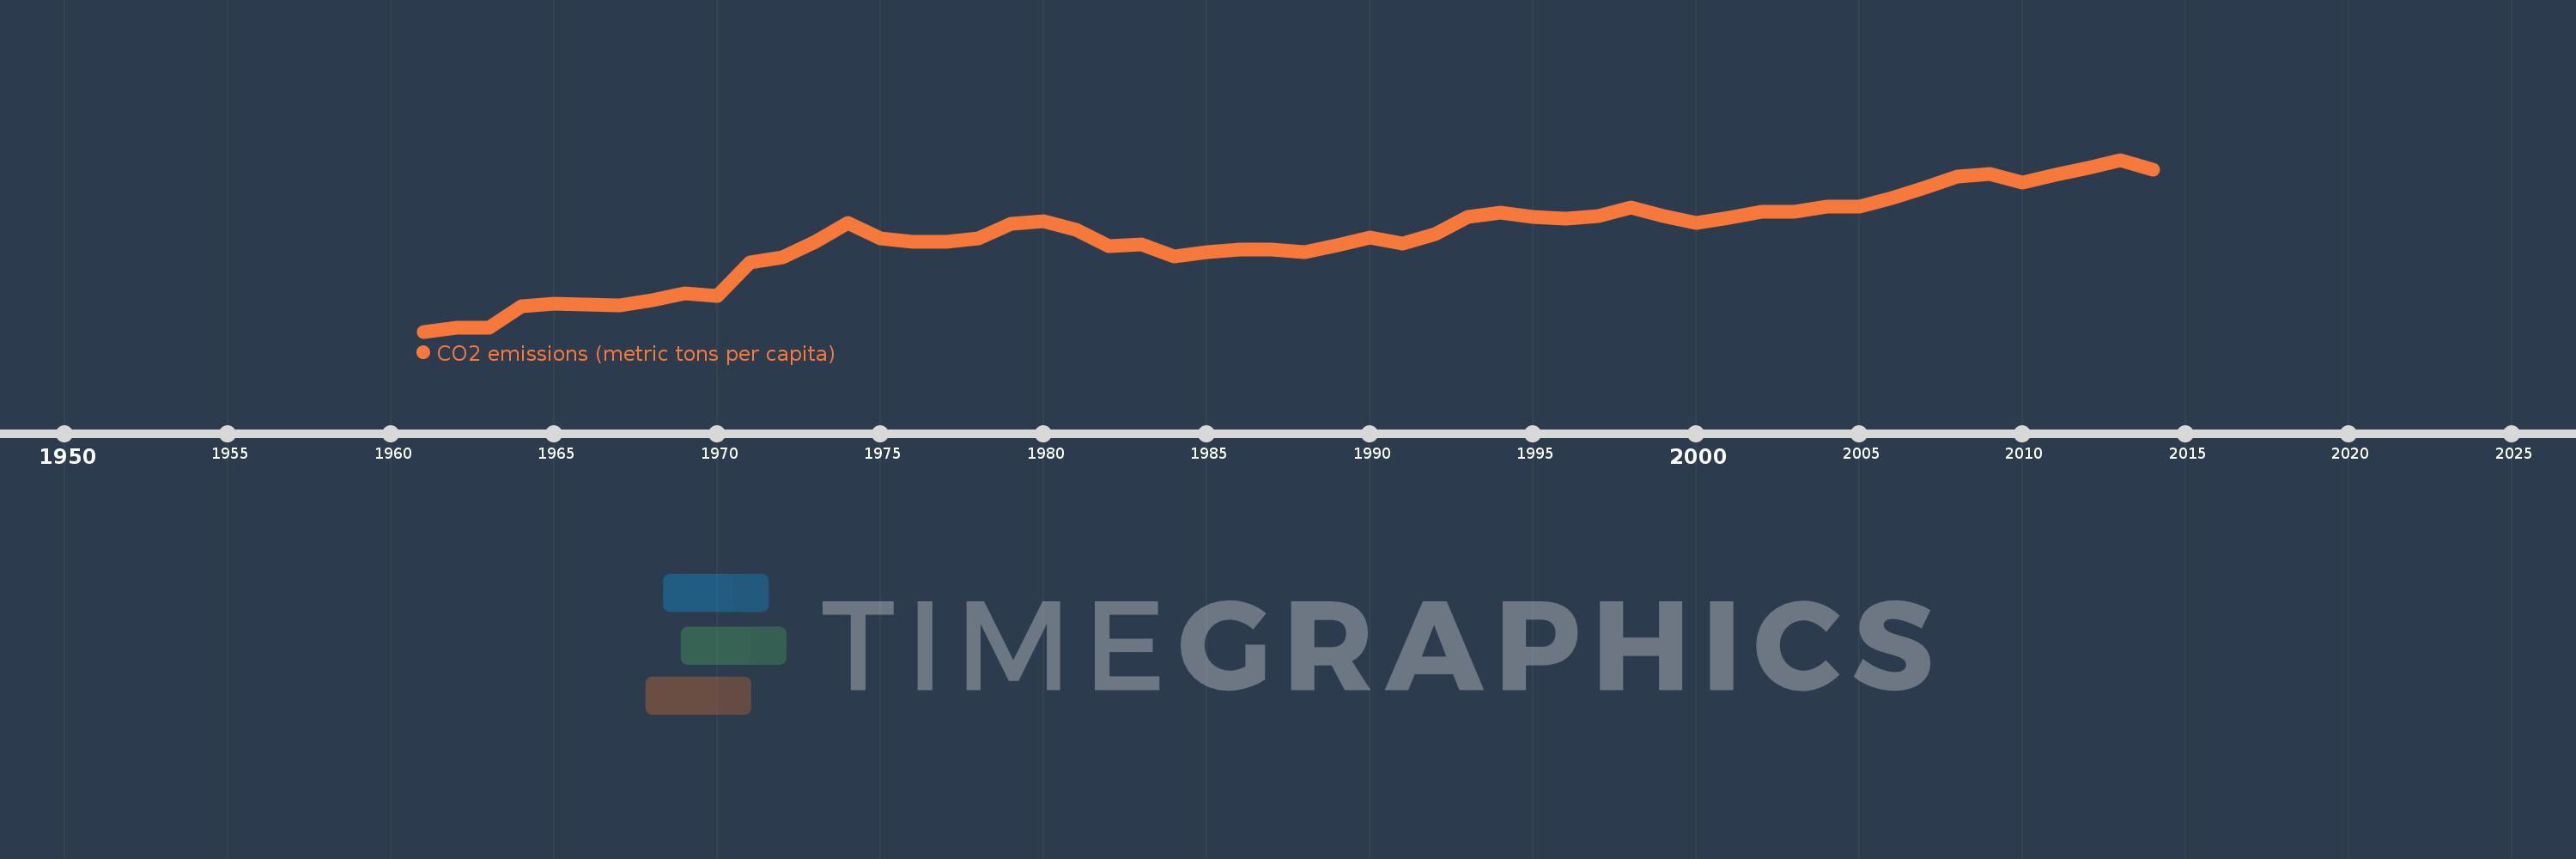
CO2 emissions (metric tons per capita)
2014,2013,2012,2011,2010,2009,2008,2007,2006,2005,2004,2003,2002,2001,2000,1999,1998,1997,1996,1995,1994,1993,1992,1991,1990,1989,1988,1987,1986,1985,1984,1983,1982,1981,1980,1979,1978,1977,1976,1975,1974,1973,1972,1971,1970,1969,1968,1967,1966,1965,1964,1963,1962,1961
This statistics in other country:
AfghanistanAlbaniaAlgeriaAndorraAngolaAntigua and BarbudaArab WorldArgentinaArmeniaArubaAustraliaAustriaAzerbaijanBahamas, TheBahrainBangladeshBarbadosBelarusBelgiumBelizeBeninBermudaBhutanBoliviaBosnia and HerzegovinaBotswanaBrazilBritish Virgin IslandsBrunei DarussalamBulgariaBurkina FasoBurundiCabo VerdeCambodiaCameroonCanadaCaribbean small statesCayman IslandsCentral African RepublicCentral Europe and the BalticsChadChileChinaColombiaComorosCongo, Dem. Rep.Congo, Rep.Costa RicaCote d'IvoireCroatiaCubaCuracaoCyprusCzech RepublicDenmarkDjiboutiDominicaDominican RepublicEarly-demographic dividendEast Asia & PacificEast Asia & Pacific (excluding high income)East Asia & Pacific (IDA & IBRD countries)EcuadorEgypt, Arab Rep.El SalvadorEquatorial GuineaEritreaEstoniaEthiopiaEuro areaEurope & Central AsiaEurope & Central Asia (excluding high income)Europe & Central Asia (IDA & IBRD countries)European UnionFaroe IslandsFijiFinlandFragile and conflict affected situationsFranceFrench PolynesiaGabonGambia, TheGeorgiaGermanyGhanaGibraltarGreeceGreenlandGrenadaGuatemalaGuineaGuinea-BissauGuyanaHaitiHeavily indebted poor countries (HIPC)High incomeHondurasHong Kong SAR, ChinaHungaryIBRD onlyIcelandIDA & IBRD totalIDA blendIDA onlyIDA totalIndiaIndonesiaIran, Islamic Rep.IraqIrelandIsraelItalyJamaicaJapanJordanKazakhstanKenyaKiribatiKorea, Dem. People’s Rep.Korea, Rep.KuwaitKyrgyz RepublicLao PDRLate-demographic dividendLatin America & Caribbean Latin America & Caribbean (excluding high income)Latin America & the Caribbean (IDA & IBRD countries)LatviaLeast developed countries: UN classificationLebanonLesothoLiberiaLibyaLiechtensteinLithuaniaLow & middle incomeLow incomeLower middle incomeLuxembourgMacao SAR, ChinaMacedonia, FYRMadagascarMalawiMalaysiaMaldivesMaliMaltaMarshall IslandsMauritaniaMauritiusMexicoMicronesia, Fed. Sts.Middle East & North AfricaMiddle East & North Africa (excluding high income)Middle East & North Africa (IDA & IBRD countries)Middle incomeMoldovaMongoliaMontenegroMoroccoMozambiqueMyanmarNamibiaNauruNepalNetherlandsNew CaledoniaNew ZealandNicaraguaNigerNigeriaNorth AmericaNorwayOECD membersOmanOther small statesPacific island small statesPakistanPalauPanamaPapua New GuineaParaguayPeruPhilippinesPolandPortugalPost-demographic dividendPre-demographic dividendQatarRomaniaRussian FederationRwandaSamoaSao Tome and PrincipeSaudi ArabiaSenegalSerbiaSeychellesSierra LeoneSingaporeSint Maarten (Dutch part)Slovak RepublicSloveniaSmall statesSolomon IslandsSomaliaSouth AfricaSouth AsiaSouth Asia (IDA & IBRD)South SudanSpainSri LankaSt. Kitts and NevisSt. LuciaSt. Vincent and the GrenadinesSub-Saharan Africa Sub-Saharan Africa (excluding high income)Sub-Saharan Africa (IDA & IBRD countries)SudanSurinameSwazilandSwedenSwitzerlandSyrian Arab RepublicTajikistanTanzaniaThailandTimor-LesteTogoTongaTrinidad and TobagoTunisiaTurkeyTurkmenistanTurks and Caicos IslandsUgandaUkraineUnited Arab EmiratesUnited KingdomUnited StatesUpper middle incomeUruguayUzbekistanVanuatuVenezuela, RBVietnamWest Bank and GazaWorldYemen, Rep.ZambiaZimbabwe Timeline:
This timeline shows a graph from 1961 to 2014 of Other small states. No data until 1960. Number of actual observations by date: 54.
Source name:
World Development Indicators
Source organization:
Carbon Dioxide Information Analysis Center, Environmental Sciences Division, Oak Ridge National Laboratory, Tennessee, United States.
Categories, topics:
Climate Change, Environment
Last updated:
apr 23, 2017
Indicators value changes by year
At the date of observation
Value
Absolute change
Change from previous value
jan 1, 1961
0.621
+0.621
0.0%
jan 1, 1962
0.76
+0.139
22.41%
jan 1, 1963
0.761
+0.002
0.22%
jan 1, 1964
1.593
+0.832
109.24%
jan 1, 1965
1.692
+0.099
6.24%
jan 1, 1966
1.66
-0.032
-1.9%
jan 1, 1967
1.626
-0.035
-2.08%
jan 1, 1968
1.826
+0.201
12.34%
jan 1, 1969
2.088
+0.261
14.3%
jan 1, 1970
1.979
-0.109
-5.2%
jan 1, 1971
3.265
+1.286
64.97%
jan 1, 1972
3.494
+0.23
7.03%
jan 1, 1973
4.059
+0.565
16.18%
jan 1, 1974
4.813
+0.753
18.55%
jan 1, 1975
4.2
-0.613
-12.73%
jan 1, 1976
4.067
-0.133
-3.17%
jan 1, 1977
4.06
-0.007
-0.18%
jan 1, 1978
4.213
+0.153
3.77%
jan 1, 1979
4.767
+0.554
13.16%
jan 1, 1980
4.872
+0.104
2.19%
jan 1, 1981
4.549
-0.322
-6.62%
jan 1, 1982
3.897
-0.652
-14.33%
jan 1, 1983
3.963
+0.066
1.68%
jan 1, 1984
3.518
-0.445
-11.24%
jan 1, 1985
3.686
+0.168
4.78%
jan 1, 1986
3.778
+0.093
2.51%
jan 1, 1987
3.77
-0.008
-0.21%
jan 1, 1988
3.686
-0.084
-2.23%
jan 1, 1989
3.935
+0.248
6.74%
jan 1, 1990
4.244
+0.309
7.86%
jan 1, 1991
4.021
-0.223
-5.24%
jan 1, 1992
4.379
+0.358
8.89%
jan 1, 1993
5.034
+0.655
14.96%
jan 1, 1994
5.204
+0.17
3.37%
jan 1, 1995
5.033
-0.17
-3.27%
jan 1, 1996
4.959
-0.075
-1.48%
jan 1, 1997
5.049
+0.09
1.82%
jan 1, 1998
5.402
+0.353
6.99%
jan 1, 1999
5.077
-0.324
-6.0%
jan 1, 2000
4.811
-0.266
-5.25%
jan 1, 2001
5.001
+0.189
3.94%
jan 1, 2002
5.214
+0.214
4.27%
jan 1, 2003
5.234
+0.02
0.38%
jan 1, 2004
5.426
+0.192
3.67%
jan 1, 2005
5.435
+0.009
0.17%
jan 1, 2006
5.769
+0.334
6.15%
jan 1, 2007
6.147
+0.378
6.55%
jan 1, 2008
6.596
+0.449
7.3%
jan 1, 2009
6.68
+0.084
1.27%
jan 1, 2010
6.345
-0.335
-5.01%
jan 1, 2011
6.637
+0.292
4.6%
jan 1, 2012
6.91
+0.274
4.13%
jan 1, 2013
7.228
+0.317
4.59%
jan 1, 2014
6.833
-0.395
-5.46%
Ranking of countries by current statistics by years


Comments: