29
/
en
AIzaSyAYiBZKx7MnpbEhh9jyipgxe19OcubqV5w
April 1, 2024
51714
North America
NAC
false
2
1
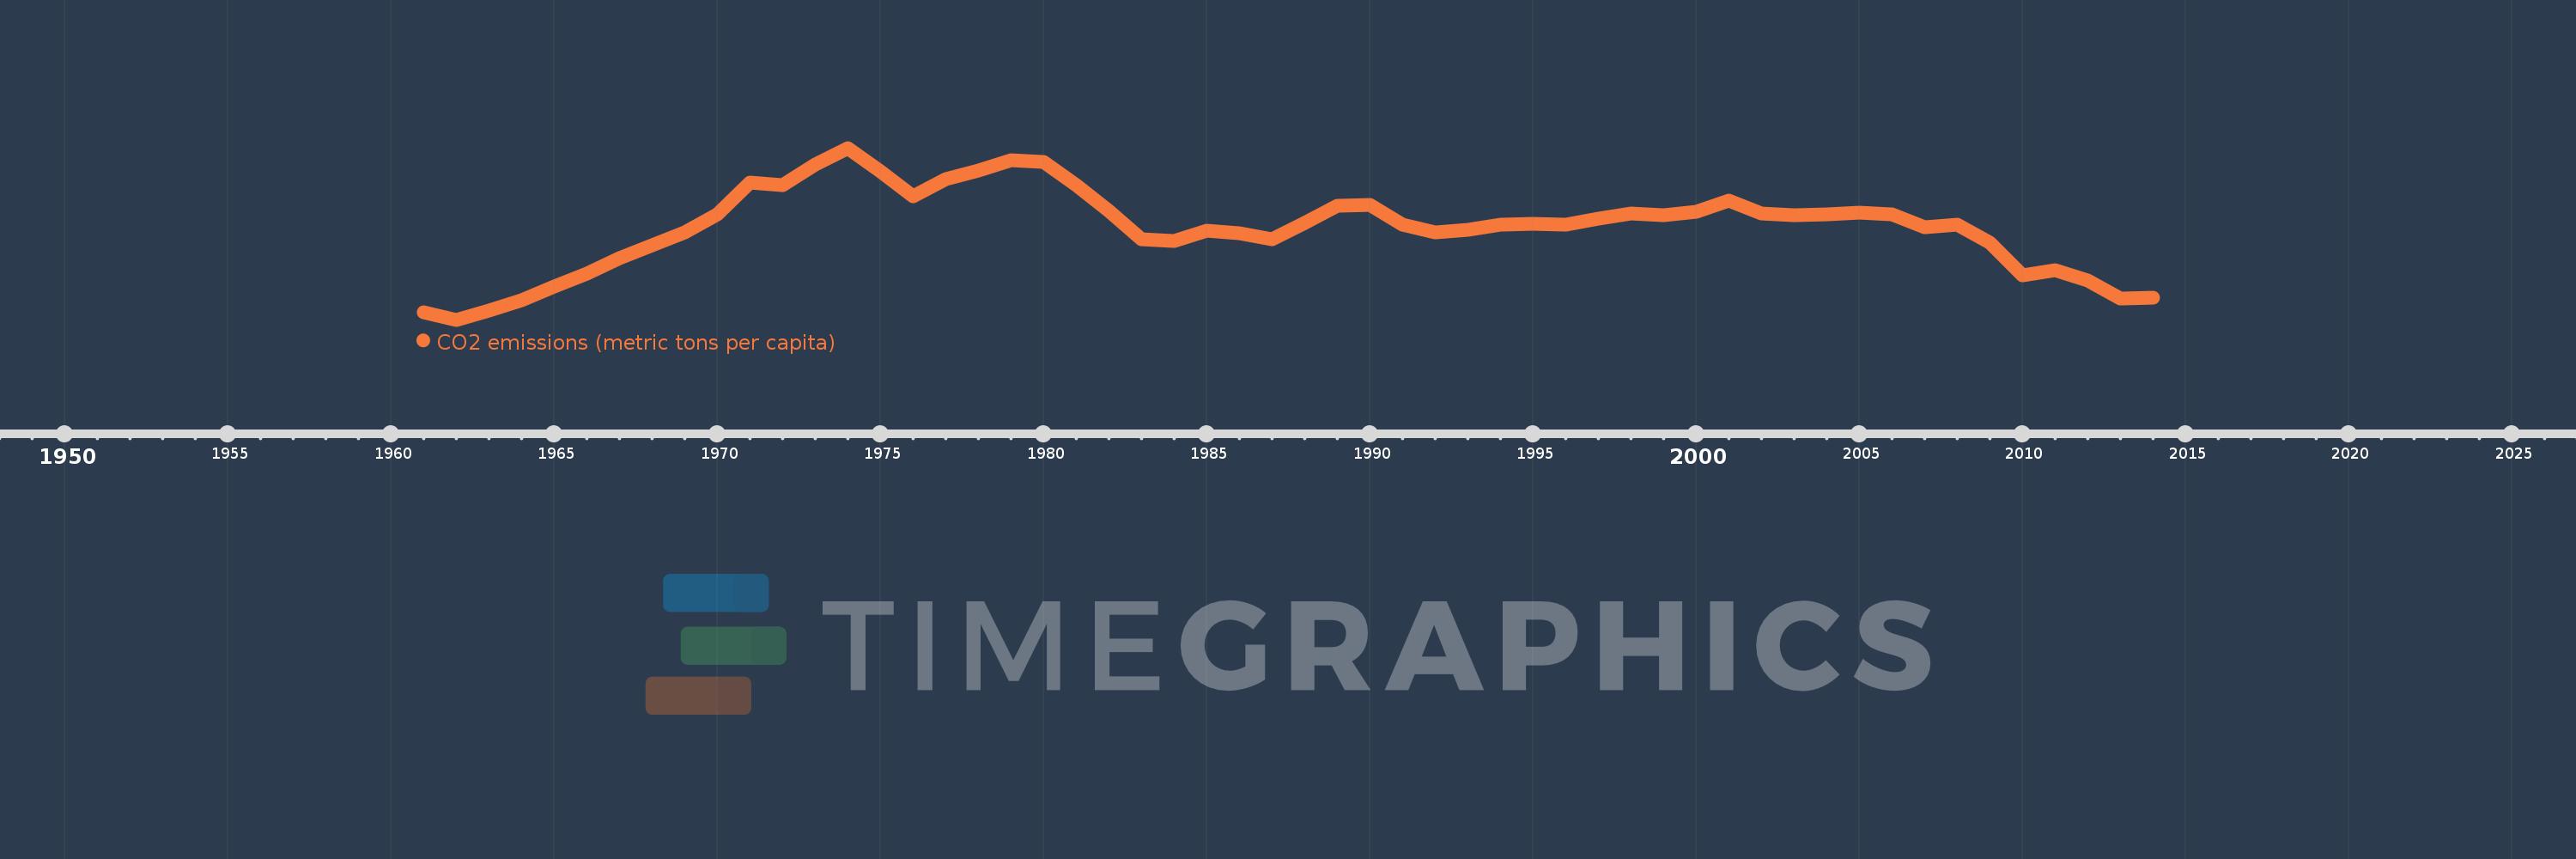
CO2 emissions (metric tons per capita)
2014,2013,2012,2011,2010,2009,2008,2007,2006,2005,2004,2003,2002,2001,2000,1999,1998,1997,1996,1995,1994,1993,1992,1991,1990,1989,1988,1987,1986,1985,1984,1983,1982,1981,1980,1979,1978,1977,1976,1975,1974,1973,1972,1971,1970,1969,1968,1967,1966,1965,1964,1963,1962,1961
This statistics in other country:
AfghanistanAlbaniaAlgeriaAndorraAngolaAntigua and BarbudaArab WorldArgentinaArmeniaArubaAustraliaAustriaAzerbaijanBahamas, TheBahrainBangladeshBarbadosBelarusBelgiumBelizeBeninBermudaBhutanBoliviaBosnia and HerzegovinaBotswanaBrazilBritish Virgin IslandsBrunei DarussalamBulgariaBurkina FasoBurundiCabo VerdeCambodiaCameroonCanadaCaribbean small statesCayman IslandsCentral African RepublicCentral Europe and the BalticsChadChileChinaColombiaComorosCongo, Dem. Rep.Congo, Rep.Costa RicaCote d'IvoireCroatiaCubaCuracaoCyprusCzech RepublicDenmarkDjiboutiDominicaDominican RepublicEarly-demographic dividendEast Asia & PacificEast Asia & Pacific (excluding high income)East Asia & Pacific (IDA & IBRD countries)EcuadorEgypt, Arab Rep.El SalvadorEquatorial GuineaEritreaEstoniaEthiopiaEuro areaEurope & Central AsiaEurope & Central Asia (excluding high income)Europe & Central Asia (IDA & IBRD countries)European UnionFaroe IslandsFijiFinlandFragile and conflict affected situationsFranceFrench PolynesiaGabonGambia, TheGeorgiaGermanyGhanaGibraltarGreeceGreenlandGrenadaGuatemalaGuineaGuinea-BissauGuyanaHaitiHeavily indebted poor countries (HIPC)High incomeHondurasHong Kong SAR, ChinaHungaryIBRD onlyIcelandIDA & IBRD totalIDA blendIDA onlyIDA totalIndiaIndonesiaIran, Islamic Rep.IraqIrelandIsraelItalyJamaicaJapanJordanKazakhstanKenyaKiribatiKorea, Dem. People’s Rep.Korea, Rep.KuwaitKyrgyz RepublicLao PDRLate-demographic dividendLatin America & Caribbean Latin America & Caribbean (excluding high income)Latin America & the Caribbean (IDA & IBRD countries)LatviaLeast developed countries: UN classificationLebanonLesothoLiberiaLibyaLiechtensteinLithuaniaLow & middle incomeLow incomeLower middle incomeLuxembourgMacao SAR, ChinaMacedonia, FYRMadagascarMalawiMalaysiaMaldivesMaliMaltaMarshall IslandsMauritaniaMauritiusMexicoMicronesia, Fed. Sts.Middle East & North AfricaMiddle East & North Africa (excluding high income)Middle East & North Africa (IDA & IBRD countries)Middle incomeMoldovaMongoliaMontenegroMoroccoMozambiqueMyanmarNamibiaNauruNepalNetherlandsNew CaledoniaNew ZealandNicaraguaNigerNigeriaNorth AmericaNorwayOECD membersOmanOther small statesPacific island small statesPakistanPalauPanamaPapua New GuineaParaguayPeruPhilippinesPolandPortugalPost-demographic dividendPre-demographic dividendQatarRomaniaRussian FederationRwandaSamoaSao Tome and PrincipeSaudi ArabiaSenegalSerbiaSeychellesSierra LeoneSingaporeSint Maarten (Dutch part)Slovak RepublicSloveniaSmall statesSolomon IslandsSomaliaSouth AfricaSouth AsiaSouth Asia (IDA & IBRD)South SudanSpainSri LankaSt. Kitts and NevisSt. LuciaSt. Vincent and the GrenadinesSub-Saharan Africa Sub-Saharan Africa (excluding high income)Sub-Saharan Africa (IDA & IBRD countries)SudanSurinameSwazilandSwedenSwitzerlandSyrian Arab RepublicTajikistanTanzaniaThailandTimor-LesteTogoTongaTrinidad and TobagoTunisiaTurkeyTurkmenistanTurks and Caicos IslandsUgandaUkraineUnited Arab EmiratesUnited KingdomUnited StatesUpper middle incomeUruguayUzbekistanVanuatuVenezuela, RBVietnamWest Bank and GazaWorldYemen, Rep.ZambiaZimbabwe Timeline:
This timeline shows a graph from 1961 to 2014 of North America. No data until 1960. Number of actual observations by date: 54.
Source name:
World Development Indicators
Source organization:
Carbon Dioxide Information Analysis Center, Environmental Sciences Division, Oak Ridge National Laboratory, Tennessee, United States.
Categories, topics:
Climate Change, Environment
Last updated:
apr 23, 2017
Indicators value changes by year
Minimum:
15.222
jan 1, 1962
Maximum:
21.987
jan 1, 1974
At the date of observation
Value
Absolute change
Change from previous value
jan 1, 1961
15.526
+15.526
0.0%
jan 1, 1962
15.222
-0.304
-1.96%
jan 1, 1963
15.568
+0.347
2.28%
jan 1, 1964
15.992
+0.424
2.73%
jan 1, 1965
16.539
+0.546
3.42%
jan 1, 1966
17.022
+0.483
2.92%
jan 1, 1967
17.638
+0.616
3.62%
jan 1, 1968
18.149
+0.511
2.9%
jan 1, 1969
18.668
+0.519
2.86%
jan 1, 1970
19.362
+0.693
3.71%
jan 1, 1971
20.627
+1.265
6.54%
jan 1, 1972
20.534
-0.094
-0.45%
jan 1, 1973
21.326
+0.792
3.86%
jan 1, 1974
21.987
+0.661
3.1%
jan 1, 1975
21.079
-0.908
-4.13%
jan 1, 1976
20.08
-0.998
-4.74%
jan 1, 1977
20.748
+0.668
3.33%
jan 1, 1978
21.103
+0.354
1.71%
jan 1, 1979
21.515
+0.412
1.95%
jan 1, 1980
21.43
-0.085
-0.39%
jan 1, 1981
20.514
-0.916
-4.27%
jan 1, 1982
19.52
-0.994
-4.85%
jan 1, 1983
18.379
-1.141
-5.84%
jan 1, 1984
18.322
-0.057
-0.31%
jan 1, 1985
18.737
+0.415
2.26%
jan 1, 1986
18.623
-0.114
-0.61%
jan 1, 1987
18.397
-0.226
-1.21%
jan 1, 1988
19.042
+0.645
3.5%
jan 1, 1989
19.706
+0.664
3.49%
jan 1, 1990
19.759
+0.053
0.27%
jan 1, 1991
18.954
-0.805
-4.07%
jan 1, 1992
18.668
-0.286
-1.51%
jan 1, 1993
18.775
+0.107
0.57%
jan 1, 1994
18.971
+0.196
1.04%
jan 1, 1995
19.008
+0.037
0.19%
jan 1, 1996
18.959
-0.048
-0.25%
jan 1, 1997
19.191
+0.232
1.22%
jan 1, 1998
19.395
+0.204
1.06%
jan 1, 1999
19.329
-0.066
-0.34%
jan 1, 2000
19.465
+0.136
0.7%
jan 1, 2001
19.926
+0.461
2.37%
jan 1, 2002
19.391
-0.535
-2.69%
jan 1, 2003
19.334
-0.057
-0.29%
jan 1, 2004
19.366
+0.032
0.16%
jan 1, 2005
19.443
+0.077
0.4%
jan 1, 2006
19.358
-0.085
-0.44%
jan 1, 2007
18.858
-0.5
-2.58%
jan 1, 2008
18.961
+0.104
0.55%
jan 1, 2009
18.264
-0.698
-3.68%
jan 1, 2010
16.958
-1.306
-7.15%
jan 1, 2011
17.186
+0.228
1.35%
jan 1, 2012
16.766
-0.421
-2.45%
jan 1, 2013
16.043
-0.722
-4.31%
jan 1, 2014
16.102
+0.059
0.37%
Ranking of countries by current statistics by years


Comments: