29
/
en
AIzaSyAYiBZKx7MnpbEhh9jyipgxe19OcubqV5w
April 1, 2024
42167
Latin America & Caribbean (excluding high income)
LAC
false
2
1
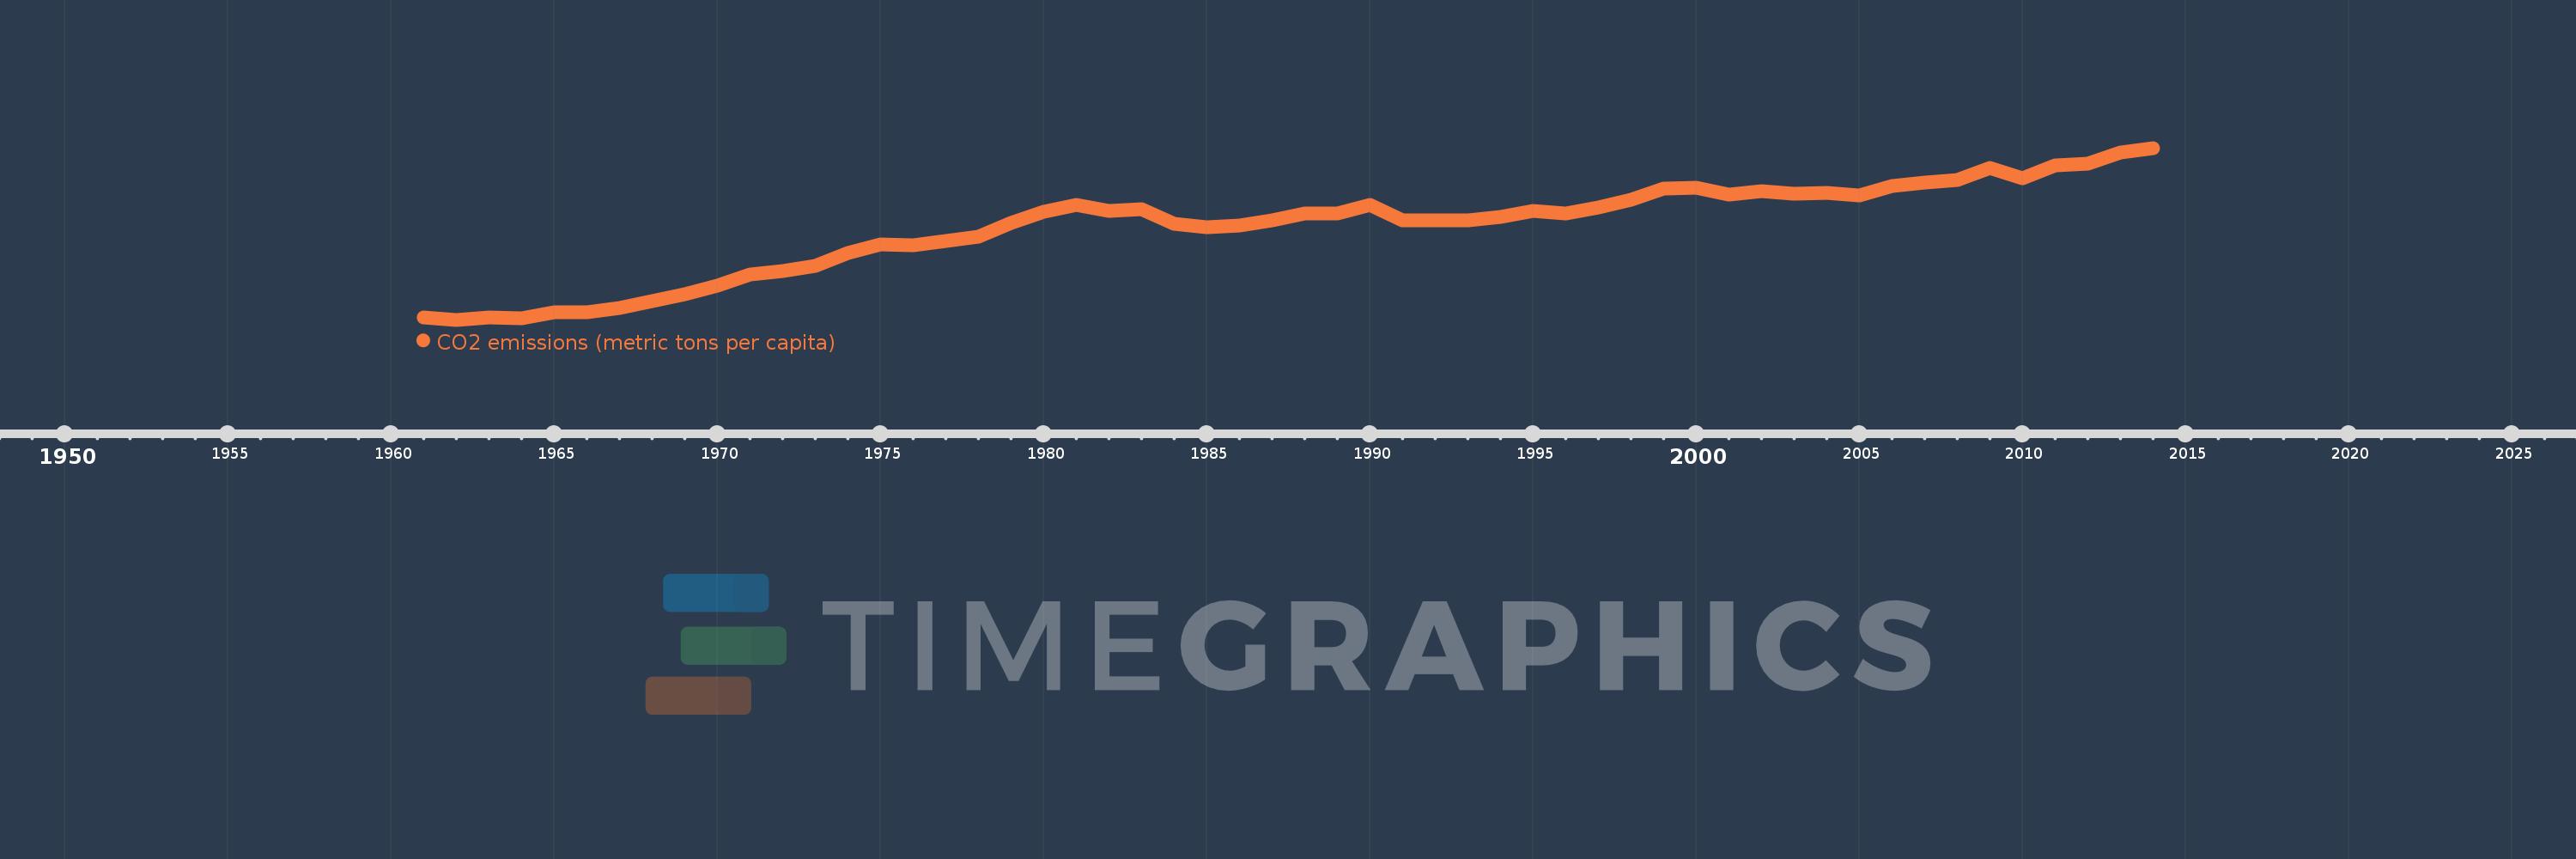
CO2 emissions (metric tons per capita)
2014,2013,2012,2011,2010,2009,2008,2007,2006,2005,2004,2003,2002,2001,2000,1999,1998,1997,1996,1995,1994,1993,1992,1991,1990,1989,1988,1987,1986,1985,1984,1983,1982,1981,1980,1979,1978,1977,1976,1975,1974,1973,1972,1971,1970,1969,1968,1967,1966,1965,1964,1963,1962,1961
This statistics in other country:
AfghanistanAlbaniaAlgeriaAndorraAngolaAntigua and BarbudaArab WorldArgentinaArmeniaArubaAustraliaAustriaAzerbaijanBahamas, TheBahrainBangladeshBarbadosBelarusBelgiumBelizeBeninBermudaBhutanBoliviaBosnia and HerzegovinaBotswanaBrazilBritish Virgin IslandsBrunei DarussalamBulgariaBurkina FasoBurundiCabo VerdeCambodiaCameroonCanadaCaribbean small statesCayman IslandsCentral African RepublicCentral Europe and the BalticsChadChileChinaColombiaComorosCongo, Dem. Rep.Congo, Rep.Costa RicaCote d'IvoireCroatiaCubaCuracaoCyprusCzech RepublicDenmarkDjiboutiDominicaDominican RepublicEarly-demographic dividendEast Asia & PacificEast Asia & Pacific (excluding high income)East Asia & Pacific (IDA & IBRD countries)EcuadorEgypt, Arab Rep.El SalvadorEquatorial GuineaEritreaEstoniaEthiopiaEuro areaEurope & Central AsiaEurope & Central Asia (excluding high income)Europe & Central Asia (IDA & IBRD countries)European UnionFaroe IslandsFijiFinlandFragile and conflict affected situationsFranceFrench PolynesiaGabonGambia, TheGeorgiaGermanyGhanaGibraltarGreeceGreenlandGrenadaGuatemalaGuineaGuinea-BissauGuyanaHaitiHeavily indebted poor countries (HIPC)High incomeHondurasHong Kong SAR, ChinaHungaryIBRD onlyIcelandIDA & IBRD totalIDA blendIDA onlyIDA totalIndiaIndonesiaIran, Islamic Rep.IraqIrelandIsraelItalyJamaicaJapanJordanKazakhstanKenyaKiribatiKorea, Dem. People’s Rep.Korea, Rep.KuwaitKyrgyz RepublicLao PDRLate-demographic dividendLatin America & Caribbean Latin America & Caribbean (excluding high income)Latin America & the Caribbean (IDA & IBRD countries)LatviaLeast developed countries: UN classificationLebanonLesothoLiberiaLibyaLiechtensteinLithuaniaLow & middle incomeLow incomeLower middle incomeLuxembourgMacao SAR, ChinaMacedonia, FYRMadagascarMalawiMalaysiaMaldivesMaliMaltaMarshall IslandsMauritaniaMauritiusMexicoMicronesia, Fed. Sts.Middle East & North AfricaMiddle East & North Africa (excluding high income)Middle East & North Africa (IDA & IBRD countries)Middle incomeMoldovaMongoliaMontenegroMoroccoMozambiqueMyanmarNamibiaNauruNepalNetherlandsNew CaledoniaNew ZealandNicaraguaNigerNigeriaNorth AmericaNorwayOECD membersOmanOther small statesPacific island small statesPakistanPalauPanamaPapua New GuineaParaguayPeruPhilippinesPolandPortugalPost-demographic dividendPre-demographic dividendQatarRomaniaRussian FederationRwandaSamoaSao Tome and PrincipeSaudi ArabiaSenegalSerbiaSeychellesSierra LeoneSingaporeSint Maarten (Dutch part)Slovak RepublicSloveniaSmall statesSolomon IslandsSomaliaSouth AfricaSouth AsiaSouth Asia (IDA & IBRD)South SudanSpainSri LankaSt. Kitts and NevisSt. LuciaSt. Vincent and the GrenadinesSub-Saharan Africa Sub-Saharan Africa (excluding high income)Sub-Saharan Africa (IDA & IBRD countries)SudanSurinameSwazilandSwedenSwitzerlandSyrian Arab RepublicTajikistanTanzaniaThailandTimor-LesteTogoTongaTrinidad and TobagoTunisiaTurkeyTurkmenistanTurks and Caicos IslandsUgandaUkraineUnited Arab EmiratesUnited KingdomUnited StatesUpper middle incomeUruguayUzbekistanVanuatuVenezuela, RBVietnamWest Bank and GazaWorldYemen, Rep.ZambiaZimbabwe Timeline:
This timeline shows a graph from 1961 to 2014 of Latin America & Caribbean (excluding high income). No data until 1960. Number of actual observations by date: 54.
Source name:
World Development Indicators
Source organization:
Carbon Dioxide Information Analysis Center, Environmental Sciences Division, Oak Ridge National Laboratory, Tennessee, United States.
Categories, topics:
Climate Change, Environment
Last updated:
apr 23, 2017
Indicators value changes by year
At the date of observation
Value
Absolute change
Change from previous value
jan 1, 1961
1.288
+1.288
0.0%
jan 1, 1962
1.268
-0.02
-1.52%
jan 1, 1963
1.291
+0.023
1.79%
jan 1, 1964
1.278
-0.012
-0.96%
jan 1, 1965
1.34
+0.062
4.82%
jan 1, 1966
1.342
+0.002
0.14%
jan 1, 1967
1.382
+0.04
2.98%
jan 1, 1968
1.448
+0.066
4.78%
jan 1, 1969
1.506
+0.058
4.02%
jan 1, 1970
1.59
+0.083
5.54%
jan 1, 1971
1.696
+0.106
6.68%
jan 1, 1972
1.731
+0.035
2.07%
jan 1, 1973
1.775
+0.044
2.55%
jan 1, 1974
1.9
+0.125
7.02%
jan 1, 1975
1.976
+0.076
4.0%
jan 1, 1976
1.973
-0.003
-0.13%
jan 1, 1977
2.008
+0.035
1.79%
jan 1, 1978
2.052
+0.043
2.15%
jan 1, 1979
2.184
+0.133
6.47%
jan 1, 1980
2.284
+0.1
4.57%
jan 1, 1981
2.352
+0.067
2.95%
jan 1, 1982
2.292
-0.06
-2.53%
jan 1, 1983
2.315
+0.023
0.99%
jan 1, 1984
2.177
-0.138
-5.94%
jan 1, 1985
2.141
-0.037
-1.68%
jan 1, 1986
2.155
+0.014
0.65%
jan 1, 1987
2.203
+0.049
2.26%
jan 1, 1988
2.27
+0.067
3.04%
jan 1, 1989
2.272
+0.002
0.08%
jan 1, 1990
2.352
+0.08
3.51%
jan 1, 1991
2.204
-0.148
-6.3%
jan 1, 1992
2.205
+0.001
0.05%
jan 1, 1993
2.203
-0.002
-0.09%
jan 1, 1994
2.242
+0.04
1.8%
jan 1, 1995
2.296
+0.054
2.39%
jan 1, 1996
2.27
-0.026
-1.14%
jan 1, 1997
2.325
+0.055
2.41%
jan 1, 1998
2.399
+0.074
3.19%
jan 1, 1999
2.507
+0.108
4.5%
jan 1, 2000
2.512
+0.006
0.24%
jan 1, 2001
2.447
-0.066
-2.61%
jan 1, 2002
2.48
+0.034
1.38%
jan 1, 2003
2.456
-0.024
-0.97%
jan 1, 2004
2.465
+0.009
0.36%
jan 1, 2005
2.444
-0.021
-0.86%
jan 1, 2006
2.534
+0.09
3.67%
jan 1, 2007
2.563
+0.029
1.15%
jan 1, 2008
2.586
+0.023
0.9%
jan 1, 2009
2.7
+0.114
4.43%
jan 1, 2010
2.6
-0.1
-3.71%
jan 1, 2011
2.722
+0.122
4.68%
jan 1, 2012
2.743
+0.021
0.79%
jan 1, 2013
2.845
+0.102
3.73%
jan 1, 2014
2.89
+0.044
1.56%
Ranking of countries by current statistics by years


Comments: