29
/
en
AIzaSyAYiBZKx7MnpbEhh9jyipgxe19OcubqV5w
April 1, 2024
192824
Mauritania
MRT
true
2
1
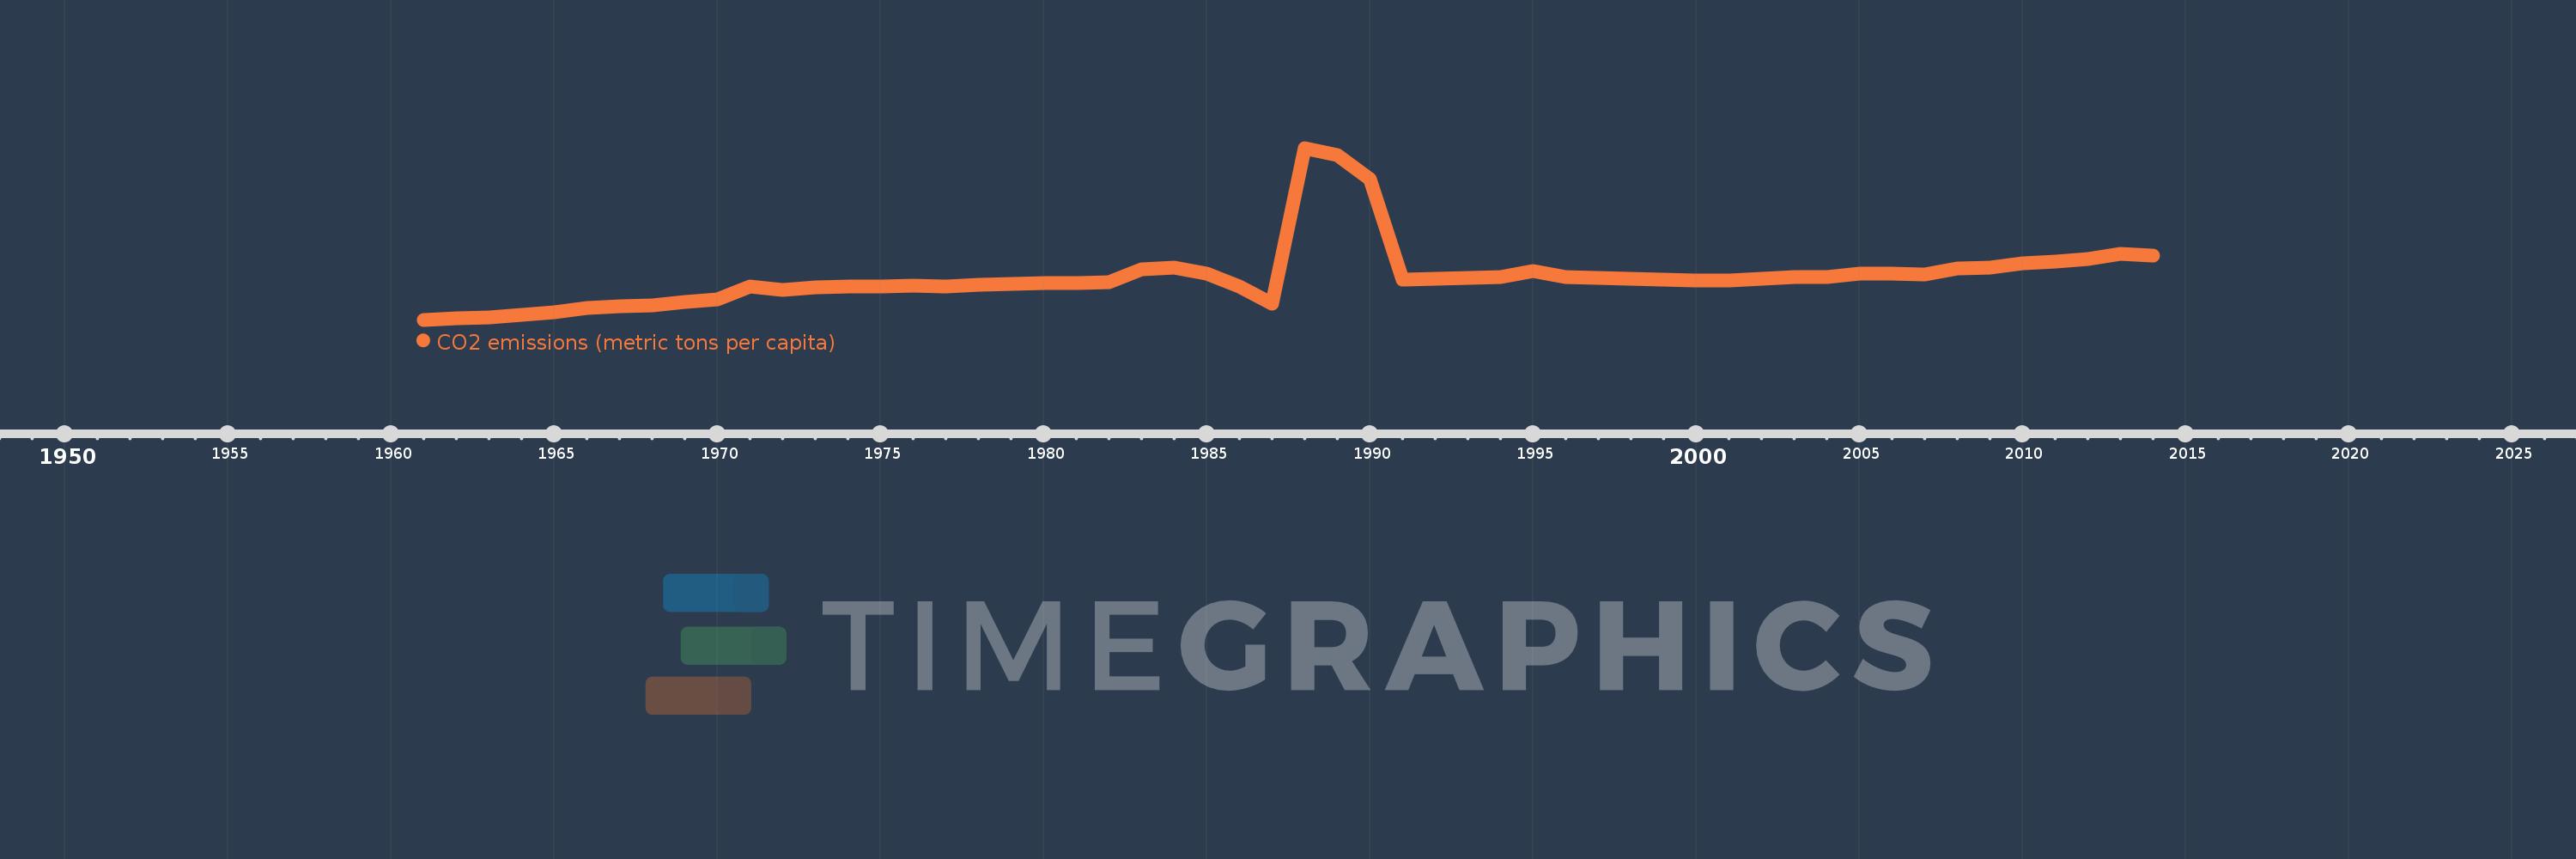
CO2 emissions (metric tons per capita)
2014,2013,2012,2011,2010,2009,2008,2007,2006,2005,2004,2003,2002,2001,2000,1999,1998,1997,1996,1995,1994,1993,1992,1991,1990,1989,1988,1987,1986,1985,1984,1983,1982,1981,1980,1979,1978,1977,1976,1975,1974,1973,1972,1971,1970,1969,1968,1967,1966,1965,1964,1963,1962,1961
This statistics in other country:
AfghanistanAlbaniaAlgeriaAndorraAngolaAntigua and BarbudaArab WorldArgentinaArmeniaArubaAustraliaAustriaAzerbaijanBahamas, TheBahrainBangladeshBarbadosBelarusBelgiumBelizeBeninBermudaBhutanBoliviaBosnia and HerzegovinaBotswanaBrazilBritish Virgin IslandsBrunei DarussalamBulgariaBurkina FasoBurundiCabo VerdeCambodiaCameroonCanadaCaribbean small statesCayman IslandsCentral African RepublicCentral Europe and the BalticsChadChileChinaColombiaComorosCongo, Dem. Rep.Congo, Rep.Costa RicaCote d'IvoireCroatiaCubaCuracaoCyprusCzech RepublicDenmarkDjiboutiDominicaDominican RepublicEarly-demographic dividendEast Asia & PacificEast Asia & Pacific (excluding high income)East Asia & Pacific (IDA & IBRD countries)EcuadorEgypt, Arab Rep.El SalvadorEquatorial GuineaEritreaEstoniaEthiopiaEuro areaEurope & Central AsiaEurope & Central Asia (excluding high income)Europe & Central Asia (IDA & IBRD countries)European UnionFaroe IslandsFijiFinlandFragile and conflict affected situationsFranceFrench PolynesiaGabonGambia, TheGeorgiaGermanyGhanaGibraltarGreeceGreenlandGrenadaGuatemalaGuineaGuinea-BissauGuyanaHaitiHeavily indebted poor countries (HIPC)High incomeHondurasHong Kong SAR, ChinaHungaryIBRD onlyIcelandIDA & IBRD totalIDA blendIDA onlyIDA totalIndiaIndonesiaIran, Islamic Rep.IraqIrelandIsraelItalyJamaicaJapanJordanKazakhstanKenyaKiribatiKorea, Dem. People’s Rep.Korea, Rep.KuwaitKyrgyz RepublicLao PDRLate-demographic dividendLatin America & Caribbean Latin America & Caribbean (excluding high income)Latin America & the Caribbean (IDA & IBRD countries)LatviaLeast developed countries: UN classificationLebanonLesothoLiberiaLibyaLiechtensteinLithuaniaLow & middle incomeLow incomeLower middle incomeLuxembourgMacao SAR, ChinaMacedonia, FYRMadagascarMalawiMalaysiaMaldivesMaliMaltaMarshall IslandsMauritaniaMauritiusMexicoMicronesia, Fed. Sts.Middle East & North AfricaMiddle East & North Africa (excluding high income)Middle East & North Africa (IDA & IBRD countries)Middle incomeMoldovaMongoliaMontenegroMoroccoMozambiqueMyanmarNamibiaNauruNepalNetherlandsNew CaledoniaNew ZealandNicaraguaNigerNigeriaNorth AmericaNorwayOECD membersOmanOther small statesPacific island small statesPakistanPalauPanamaPapua New GuineaParaguayPeruPhilippinesPolandPortugalPost-demographic dividendPre-demographic dividendQatarRomaniaRussian FederationRwandaSamoaSao Tome and PrincipeSaudi ArabiaSenegalSerbiaSeychellesSierra LeoneSingaporeSint Maarten (Dutch part)Slovak RepublicSloveniaSmall statesSolomon IslandsSomaliaSouth AfricaSouth AsiaSouth Asia (IDA & IBRD)South SudanSpainSri LankaSt. Kitts and NevisSt. LuciaSt. Vincent and the GrenadinesSub-Saharan Africa Sub-Saharan Africa (excluding high income)Sub-Saharan Africa (IDA & IBRD countries)SudanSurinameSwazilandSwedenSwitzerlandSyrian Arab RepublicTajikistanTanzaniaThailandTimor-LesteTogoTongaTrinidad and TobagoTunisiaTurkeyTurkmenistanTurks and Caicos IslandsUgandaUkraineUnited Arab EmiratesUnited KingdomUnited StatesUpper middle incomeUruguayUzbekistanVanuatuVenezuela, RBVietnamWest Bank and GazaWorldYemen, Rep.ZambiaZimbabwe Timeline:
This timeline shows a graph from 1961 to 2014 of Mauritania. No data until 1960. Number of actual observations by date: 54.
Source name:
World Development Indicators
Source organization:
Carbon Dioxide Information Analysis Center, Environmental Sciences Division, Oak Ridge National Laboratory, Tennessee, United States.
Categories, topics:
Climate Change, Environment
Last updated:
apr 23, 2017
Indicators value changes by year
At the date of observation
Value
Absolute change
Change from previous value
jan 1, 1961
0.043
+0.043
0.0%
jan 1, 1962
0.054
+0.011
26.31%
jan 1, 1963
0.069
+0.015
27.04%
jan 1, 1964
0.094
+0.025
37.13%
jan 1, 1965
0.122
+0.028
29.5%
jan 1, 1966
0.163
+0.041
33.53%
jan 1, 1967
0.176
+0.013
8.15%
jan 1, 1968
0.188
+0.012
7.02%
jan 1, 1969
0.217
+0.028
15.09%
jan 1, 1970
0.246
+0.03
13.81%
jan 1, 1971
0.373
+0.127
51.5%
jan 1, 1972
0.338
-0.036
-9.52%
jan 1, 1973
0.367
+0.029
8.71%
jan 1, 1974
0.374
+0.007
1.91%
jan 1, 1975
0.375
+0.001
0.18%
jan 1, 1976
0.384
+0.009
2.3%
jan 1, 1977
0.378
-0.006
-1.45%
jan 1, 1978
0.396
+0.018
4.74%
jan 1, 1979
0.402
+0.007
1.64%
jan 1, 1980
0.406
+0.003
0.84%
jan 1, 1981
0.411
+0.005
1.3%
jan 1, 1982
0.42
+0.009
2.27%
jan 1, 1983
0.544
+0.124
29.4%
jan 1, 1984
0.562
+0.018
3.25%
jan 1, 1985
0.508
-0.054
-9.6%
jan 1, 1986
0.372
-0.136
-26.84%
jan 1, 1987
0.206
-0.166
-44.55%
jan 1, 1988
1.761
+1.555
755.04%
jan 1, 1989
1.686
-0.075
-4.29%
jan 1, 1990
1.447
-0.239
-14.16%
jan 1, 1991
0.448
-1.0
-69.07%
jan 1, 1992
0.453
+0.005
1.19%
jan 1, 1993
0.464
+0.011
2.52%
jan 1, 1994
0.466
+0.002
0.41%
jan 1, 1995
0.529
+0.063
13.46%
jan 1, 1996
0.468
-0.061
-11.49%
jan 1, 1997
0.464
-0.004
-0.95%
jan 1, 1998
0.452
-0.012
-2.6%
jan 1, 1999
0.44
-0.012
-2.63%
jan 1, 2000
0.436
-0.003
-0.76%
jan 1, 2001
0.433
-0.004
-0.84%
jan 1, 2002
0.455
+0.022
5.14%
jan 1, 2003
0.468
+0.013
2.81%
jan 1, 2004
0.467
-0.001
-0.13%
jan 1, 2005
0.501
+0.034
7.3%
jan 1, 2006
0.503
+0.002
0.42%
jan 1, 2007
0.497
-0.007
-1.36%
jan 1, 2008
0.554
+0.058
11.6%
jan 1, 2009
0.567
+0.013
2.32%
jan 1, 2010
0.606
+0.039
6.92%
jan 1, 2011
0.623
+0.017
2.73%
jan 1, 2012
0.65
+0.027
4.38%
jan 1, 2013
0.703
+0.053
8.12%
jan 1, 2014
0.684
-0.019
-2.74%
Ranking of countries by current statistics by years


Comments: