29
/
en
AIzaSyAYiBZKx7MnpbEhh9jyipgxe19OcubqV5w
April 1, 2024
225695
Portugal
PRT
true
2
1
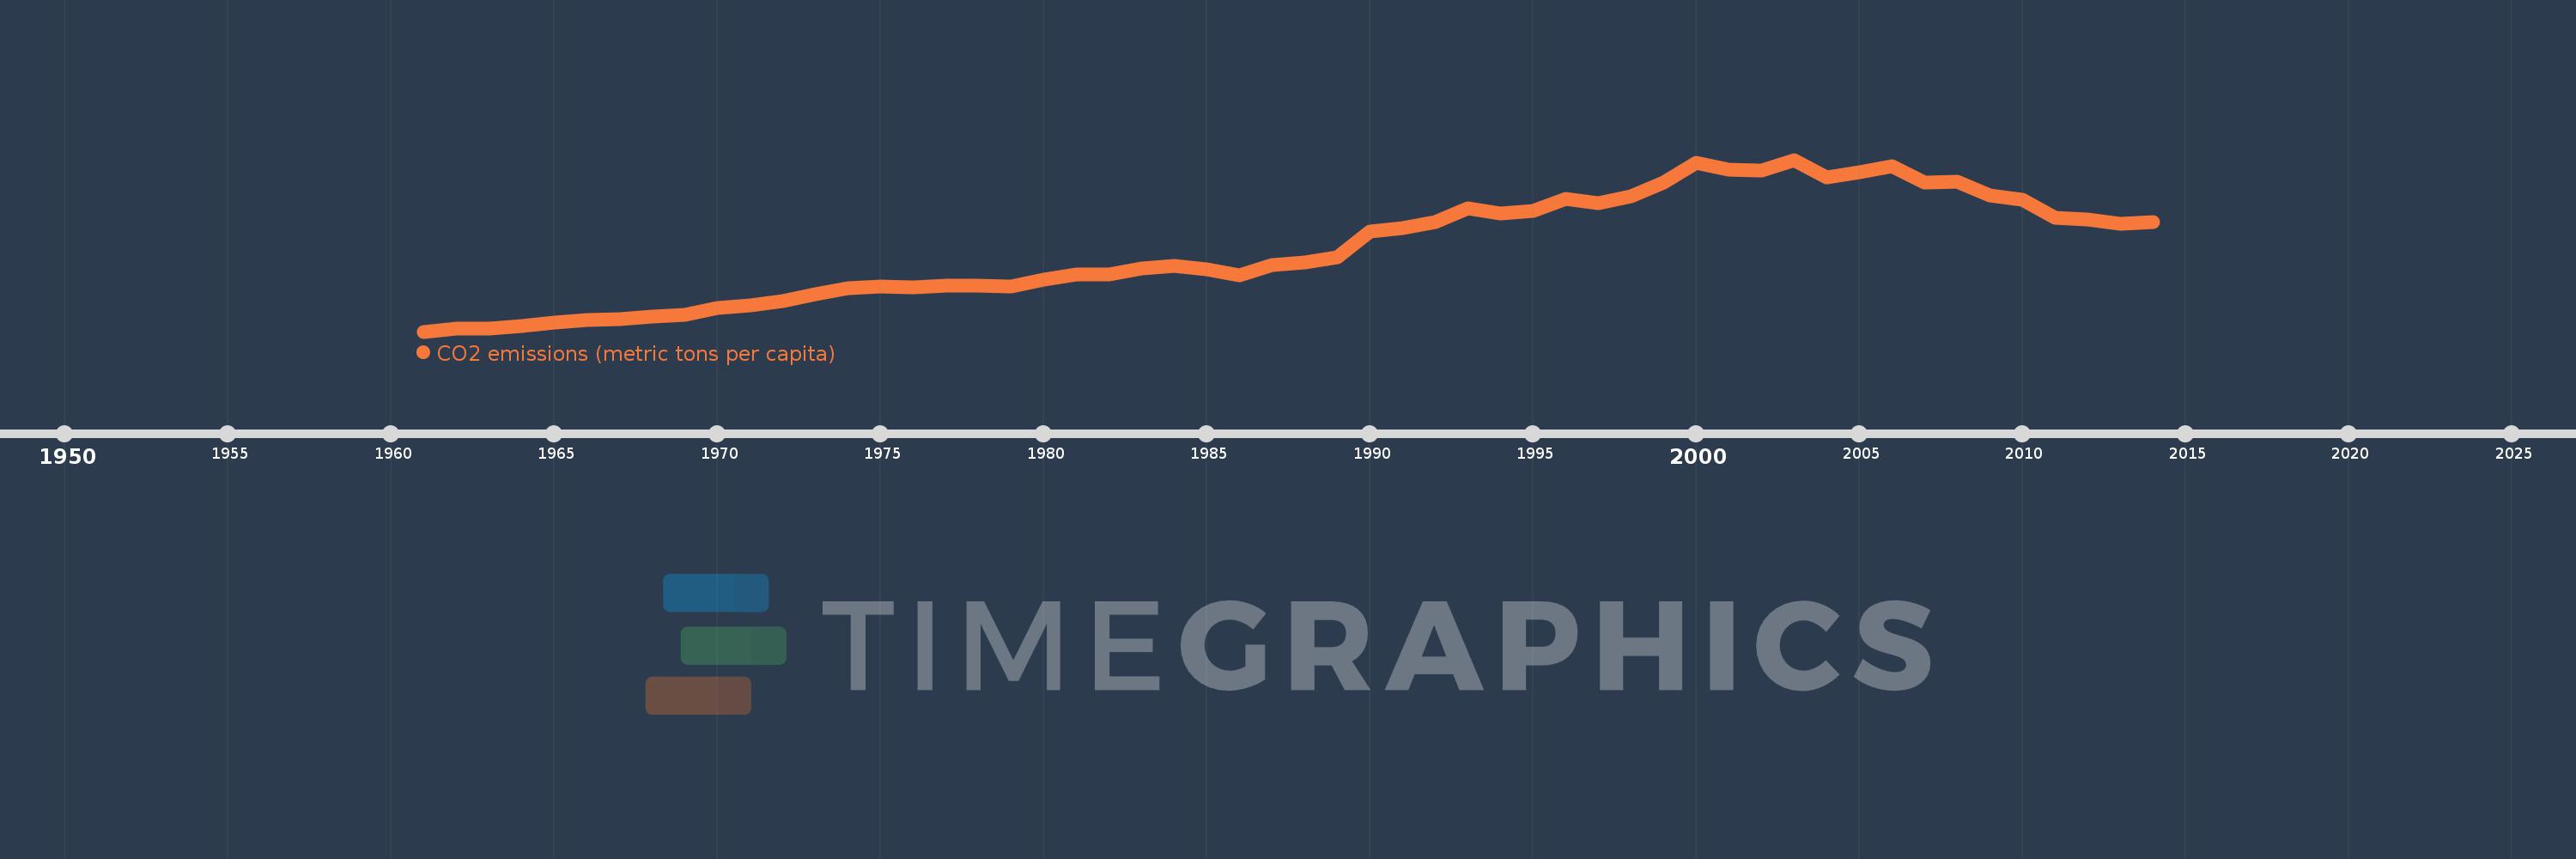
CO2 emissions (metric tons per capita)
2014,2013,2012,2011,2010,2009,2008,2007,2006,2005,2004,2003,2002,2001,2000,1999,1998,1997,1996,1995,1994,1993,1992,1991,1990,1989,1988,1987,1986,1985,1984,1983,1982,1981,1980,1979,1978,1977,1976,1975,1974,1973,1972,1971,1970,1969,1968,1967,1966,1965,1964,1963,1962,1961
This statistics in other country:
AfghanistanAlbaniaAlgeriaAndorraAngolaAntigua and BarbudaArab WorldArgentinaArmeniaArubaAustraliaAustriaAzerbaijanBahamas, TheBahrainBangladeshBarbadosBelarusBelgiumBelizeBeninBermudaBhutanBoliviaBosnia and HerzegovinaBotswanaBrazilBritish Virgin IslandsBrunei DarussalamBulgariaBurkina FasoBurundiCabo VerdeCambodiaCameroonCanadaCaribbean small statesCayman IslandsCentral African RepublicCentral Europe and the BalticsChadChileChinaColombiaComorosCongo, Dem. Rep.Congo, Rep.Costa RicaCote d'IvoireCroatiaCubaCuracaoCyprusCzech RepublicDenmarkDjiboutiDominicaDominican RepublicEarly-demographic dividendEast Asia & PacificEast Asia & Pacific (excluding high income)East Asia & Pacific (IDA & IBRD countries)EcuadorEgypt, Arab Rep.El SalvadorEquatorial GuineaEritreaEstoniaEthiopiaEuro areaEurope & Central AsiaEurope & Central Asia (excluding high income)Europe & Central Asia (IDA & IBRD countries)European UnionFaroe IslandsFijiFinlandFragile and conflict affected situationsFranceFrench PolynesiaGabonGambia, TheGeorgiaGermanyGhanaGibraltarGreeceGreenlandGrenadaGuatemalaGuineaGuinea-BissauGuyanaHaitiHeavily indebted poor countries (HIPC)High incomeHondurasHong Kong SAR, ChinaHungaryIBRD onlyIcelandIDA & IBRD totalIDA blendIDA onlyIDA totalIndiaIndonesiaIran, Islamic Rep.IraqIrelandIsraelItalyJamaicaJapanJordanKazakhstanKenyaKiribatiKorea, Dem. People’s Rep.Korea, Rep.KuwaitKyrgyz RepublicLao PDRLate-demographic dividendLatin America & Caribbean Latin America & Caribbean (excluding high income)Latin America & the Caribbean (IDA & IBRD countries)LatviaLeast developed countries: UN classificationLebanonLesothoLiberiaLibyaLiechtensteinLithuaniaLow & middle incomeLow incomeLower middle incomeLuxembourgMacao SAR, ChinaMacedonia, FYRMadagascarMalawiMalaysiaMaldivesMaliMaltaMarshall IslandsMauritaniaMauritiusMexicoMicronesia, Fed. Sts.Middle East & North AfricaMiddle East & North Africa (excluding high income)Middle East & North Africa (IDA & IBRD countries)Middle incomeMoldovaMongoliaMontenegroMoroccoMozambiqueMyanmarNamibiaNauruNepalNetherlandsNew CaledoniaNew ZealandNicaraguaNigerNigeriaNorth AmericaNorwayOECD membersOmanOther small statesPacific island small statesPakistanPalauPanamaPapua New GuineaParaguayPeruPhilippinesPolandPortugalPost-demographic dividendPre-demographic dividendQatarRomaniaRussian FederationRwandaSamoaSao Tome and PrincipeSaudi ArabiaSenegalSerbiaSeychellesSierra LeoneSingaporeSint Maarten (Dutch part)Slovak RepublicSloveniaSmall statesSolomon IslandsSomaliaSouth AfricaSouth AsiaSouth Asia (IDA & IBRD)South SudanSpainSri LankaSt. Kitts and NevisSt. LuciaSt. Vincent and the GrenadinesSub-Saharan Africa Sub-Saharan Africa (excluding high income)Sub-Saharan Africa (IDA & IBRD countries)SudanSurinameSwazilandSwedenSwitzerlandSyrian Arab RepublicTajikistanTanzaniaThailandTimor-LesteTogoTongaTrinidad and TobagoTunisiaTurkeyTurkmenistanTurks and Caicos IslandsUgandaUkraineUnited Arab EmiratesUnited KingdomUnited StatesUpper middle incomeUruguayUzbekistanVanuatuVenezuela, RBVietnamWest Bank and GazaWorldYemen, Rep.ZambiaZimbabwe Timeline:
This timeline shows a graph from 1961 to 2014 of Portugal. No data until 1960. Number of actual observations by date: 54.
Source name:
World Development Indicators
Source organization:
Carbon Dioxide Information Analysis Center, Environmental Sciences Division, Oak Ridge National Laboratory, Tennessee, United States.
Categories, topics:
Climate Change, Environment
Last updated:
apr 23, 2017
Indicators value changes by year
At the date of observation
Value
Absolute change
Change from previous value
jan 1, 1961
0.929
+0.929
0.0%
jan 1, 1962
1.018
+0.089
9.64%
jan 1, 1963
1.034
+0.016
1.6%
jan 1, 1964
1.11
+0.076
7.33%
jan 1, 1965
1.22
+0.11
9.89%
jan 1, 1966
1.289
+0.069
5.65%
jan 1, 1967
1.327
+0.038
2.95%
jan 1, 1968
1.398
+0.071
5.37%
jan 1, 1969
1.472
+0.074
5.3%
jan 1, 1970
1.669
+0.196
13.33%
jan 1, 1971
1.758
+0.089
5.35%
jan 1, 1972
1.898
+0.14
7.98%
jan 1, 1973
2.126
+0.228
12.02%
jan 1, 1974
2.317
+0.191
8.98%
jan 1, 1975
2.366
+0.049
2.12%
jan 1, 1976
2.349
-0.018
-0.75%
jan 1, 1977
2.397
+0.048
2.05%
jan 1, 1978
2.404
+0.007
0.29%
jan 1, 1979
2.379
-0.024
-1.01%
jan 1, 1980
2.591
+0.211
8.89%
jan 1, 1981
2.763
+0.172
6.65%
jan 1, 1982
2.764
+0.001
0.03%
jan 1, 1983
2.952
+0.188
6.79%
jan 1, 1984
3.031
+0.079
2.68%
jan 1, 1985
2.908
-0.123
-4.06%
jan 1, 1986
2.734
-0.173
-5.96%
jan 1, 1987
3.042
+0.308
11.26%
jan 1, 1988
3.144
+0.102
3.36%
jan 1, 1989
3.286
+0.142
4.52%
jan 1, 1990
4.119
+0.833
25.34%
jan 1, 1991
4.239
+0.12
2.92%
jan 1, 1992
4.417
+0.178
4.19%
jan 1, 1993
4.851
+0.434
9.83%
jan 1, 1994
4.709
-0.142
-2.92%
jan 1, 1995
4.77
+0.061
1.29%
jan 1, 1996
5.173
+0.403
8.46%
jan 1, 1997
5.026
-0.147
-2.84%
jan 1, 1998
5.25
+0.224
4.45%
jan 1, 1999
5.691
+0.441
8.39%
jan 1, 2000
6.305
+0.615
10.8%
jan 1, 2001
6.096
-0.209
-3.31%
jan 1, 2002
6.056
-0.04
-0.66%
jan 1, 2003
6.41
+0.354
5.85%
jan 1, 2004
5.853
-0.557
-8.69%
jan 1, 2005
6.023
+0.17
2.9%
jan 1, 2006
6.215
+0.192
3.19%
jan 1, 2007
5.685
-0.53
-8.53%
jan 1, 2008
5.705
+0.021
0.36%
jan 1, 2009
5.268
-0.437
-7.66%
jan 1, 2010
5.126
-0.142
-2.7%
jan 1, 2011
4.553
-0.574
-11.19%
jan 1, 2012
4.511
-0.042
-0.92%
jan 1, 2013
4.381
-0.13
-2.89%
jan 1, 2014
4.424
+0.043
0.99%
Ranking of countries by current statistics by years


Comments: