29
/
en
AIzaSyAYiBZKx7MnpbEhh9jyipgxe19OcubqV5w
April 1, 2024
132950
Finland
FIN
true
2
1
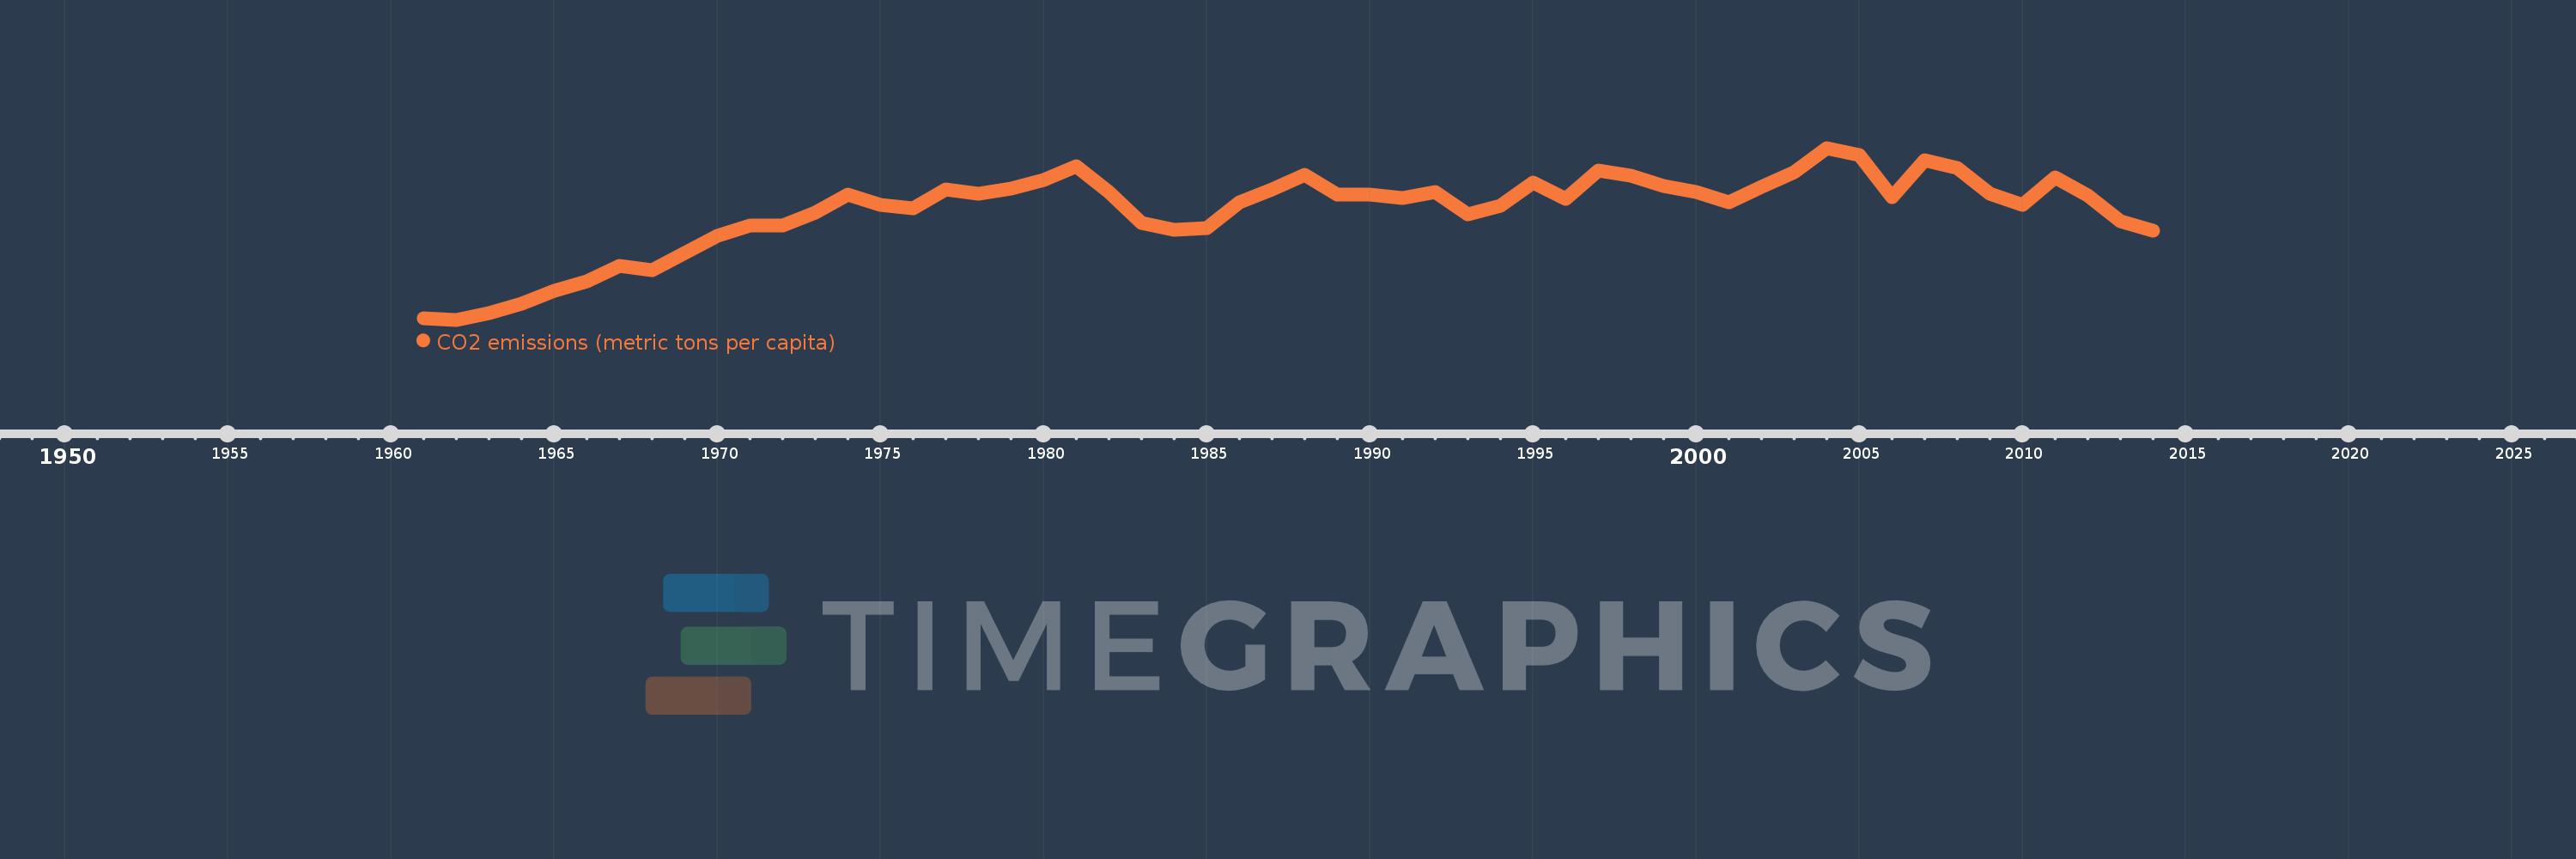
CO2 emissions (metric tons per capita)
2014,2013,2012,2011,2010,2009,2008,2007,2006,2005,2004,2003,2002,2001,2000,1999,1998,1997,1996,1995,1994,1993,1992,1991,1990,1989,1988,1987,1986,1985,1984,1983,1982,1981,1980,1979,1978,1977,1976,1975,1974,1973,1972,1971,1970,1969,1968,1967,1966,1965,1964,1963,1962,1961
This statistics in other country:
AfghanistanAlbaniaAlgeriaAndorraAngolaAntigua and BarbudaArab WorldArgentinaArmeniaArubaAustraliaAustriaAzerbaijanBahamas, TheBahrainBangladeshBarbadosBelarusBelgiumBelizeBeninBermudaBhutanBoliviaBosnia and HerzegovinaBotswanaBrazilBritish Virgin IslandsBrunei DarussalamBulgariaBurkina FasoBurundiCabo VerdeCambodiaCameroonCanadaCaribbean small statesCayman IslandsCentral African RepublicCentral Europe and the BalticsChadChileChinaColombiaComorosCongo, Dem. Rep.Congo, Rep.Costa RicaCote d'IvoireCroatiaCubaCuracaoCyprusCzech RepublicDenmarkDjiboutiDominicaDominican RepublicEarly-demographic dividendEast Asia & PacificEast Asia & Pacific (excluding high income)East Asia & Pacific (IDA & IBRD countries)EcuadorEgypt, Arab Rep.El SalvadorEquatorial GuineaEritreaEstoniaEthiopiaEuro areaEurope & Central AsiaEurope & Central Asia (excluding high income)Europe & Central Asia (IDA & IBRD countries)European UnionFaroe IslandsFijiFinlandFragile and conflict affected situationsFranceFrench PolynesiaGabonGambia, TheGeorgiaGermanyGhanaGibraltarGreeceGreenlandGrenadaGuatemalaGuineaGuinea-BissauGuyanaHaitiHeavily indebted poor countries (HIPC)High incomeHondurasHong Kong SAR, ChinaHungaryIBRD onlyIcelandIDA & IBRD totalIDA blendIDA onlyIDA totalIndiaIndonesiaIran, Islamic Rep.IraqIrelandIsraelItalyJamaicaJapanJordanKazakhstanKenyaKiribatiKorea, Dem. People’s Rep.Korea, Rep.KuwaitKyrgyz RepublicLao PDRLate-demographic dividendLatin America & Caribbean Latin America & Caribbean (excluding high income)Latin America & the Caribbean (IDA & IBRD countries)LatviaLeast developed countries: UN classificationLebanonLesothoLiberiaLibyaLiechtensteinLithuaniaLow & middle incomeLow incomeLower middle incomeLuxembourgMacao SAR, ChinaMacedonia, FYRMadagascarMalawiMalaysiaMaldivesMaliMaltaMarshall IslandsMauritaniaMauritiusMexicoMicronesia, Fed. Sts.Middle East & North AfricaMiddle East & North Africa (excluding high income)Middle East & North Africa (IDA & IBRD countries)Middle incomeMoldovaMongoliaMontenegroMoroccoMozambiqueMyanmarNamibiaNauruNepalNetherlandsNew CaledoniaNew ZealandNicaraguaNigerNigeriaNorth AmericaNorwayOECD membersOmanOther small statesPacific island small statesPakistanPalauPanamaPapua New GuineaParaguayPeruPhilippinesPolandPortugalPost-demographic dividendPre-demographic dividendQatarRomaniaRussian FederationRwandaSamoaSao Tome and PrincipeSaudi ArabiaSenegalSerbiaSeychellesSierra LeoneSingaporeSint Maarten (Dutch part)Slovak RepublicSloveniaSmall statesSolomon IslandsSomaliaSouth AfricaSouth AsiaSouth Asia (IDA & IBRD)South SudanSpainSri LankaSt. Kitts and NevisSt. LuciaSt. Vincent and the GrenadinesSub-Saharan Africa Sub-Saharan Africa (excluding high income)Sub-Saharan Africa (IDA & IBRD countries)SudanSurinameSwazilandSwedenSwitzerlandSyrian Arab RepublicTajikistanTanzaniaThailandTimor-LesteTogoTongaTrinidad and TobagoTunisiaTurkeyTurkmenistanTurks and Caicos IslandsUgandaUkraineUnited Arab EmiratesUnited KingdomUnited StatesUpper middle incomeUruguayUzbekistanVanuatuVenezuela, RBVietnamWest Bank and GazaWorldYemen, Rep.ZambiaZimbabwe Timeline:
This timeline shows a graph from 1961 to 2014 of Finland. No data until 1960. Number of actual observations by date: 54.
Source name:
World Development Indicators
Source organization:
Carbon Dioxide Information Analysis Center, Environmental Sciences Division, Oak Ridge National Laboratory, Tennessee, United States.
Categories, topics:
Climate Change, Environment
Last updated:
apr 23, 2017
Indicators value changes by year
Maximum:
13.261
jan 1, 2004
At the date of observation
Value
Absolute change
Change from previous value
jan 1, 1961
3.41
+3.41
0.0%
jan 1, 1962
3.349
-0.061
-1.79%
jan 1, 1963
3.743
+0.394
11.76%
jan 1, 1964
4.28
+0.537
14.35%
jan 1, 1965
5.024
+0.745
17.4%
jan 1, 1966
5.55
+0.526
10.46%
jan 1, 1967
6.444
+0.894
16.11%
jan 1, 1968
6.213
-0.231
-3.58%
jan 1, 1969
7.201
+0.988
15.89%
jan 1, 1970
8.204
+1.003
13.94%
jan 1, 1971
8.77
+0.565
6.89%
jan 1, 1972
8.799
+0.029
0.34%
jan 1, 1973
9.518
+0.719
8.17%
jan 1, 1974
10.584
+1.066
11.2%
jan 1, 1975
9.952
-0.632
-5.97%
jan 1, 1976
9.785
-0.167
-1.68%
jan 1, 1977
10.851
+1.066
10.9%
jan 1, 1978
10.597
-0.254
-2.34%
jan 1, 1979
10.923
+0.326
3.08%
jan 1, 1980
11.403
+0.48
4.39%
jan 1, 1981
12.187
+0.783
6.87%
jan 1, 1982
10.731
-1.455
-11.94%
jan 1, 1983
8.926
-1.806
-16.83%
jan 1, 1984
8.562
-0.363
-4.07%
jan 1, 1985
8.656
+0.093
1.09%
jan 1, 1986
10.131
+1.476
17.05%
jan 1, 1987
10.843
+0.712
7.03%
jan 1, 1988
11.69
+0.847
7.81%
jan 1, 1989
10.55
-1.14
-9.75%
jan 1, 1990
10.592
+0.042
0.4%
jan 1, 1991
10.377
-0.215
-2.03%
jan 1, 1992
10.71
+0.333
3.21%
jan 1, 1993
9.416
-1.295
-12.09%
jan 1, 1994
9.948
+0.533
5.66%
jan 1, 1995
11.246
+1.298
13.04%
jan 1, 1996
10.32
-0.926
-8.23%
jan 1, 1997
11.959
+1.638
15.88%
jan 1, 1998
11.661
-0.298
-2.49%
jan 1, 1999
11.058
-0.602
-5.17%
jan 1, 2000
10.73
-0.329
-2.97%
jan 1, 2001
10.128
-0.601
-5.6%
jan 1, 2002
10.997
+0.868
8.57%
jan 1, 2003
11.861
+0.864
7.86%
jan 1, 2004
13.261
+1.4
11.81%
jan 1, 2005
12.833
-0.428
-3.23%
jan 1, 2006
10.416
-2.416
-18.83%
jan 1, 2007
12.571
+2.154
20.68%
jan 1, 2008
12.098
-0.472
-3.76%
jan 1, 2009
10.637
-1.461
-12.08%
jan 1, 2010
9.955
-0.682
-6.41%
jan 1, 2011
11.543
+1.588
15.95%
jan 1, 2012
10.511
-1.032
-8.94%
jan 1, 2013
9.019
-1.493
-14.2%
jan 1, 2014
8.513
-0.506
-5.61%
Ranking of countries by current statistics by years


Comments: