29
/
en
AIzaSyAYiBZKx7MnpbEhh9jyipgxe19OcubqV5w
April 1, 2024
64429
Albania
ALB
true
2
1
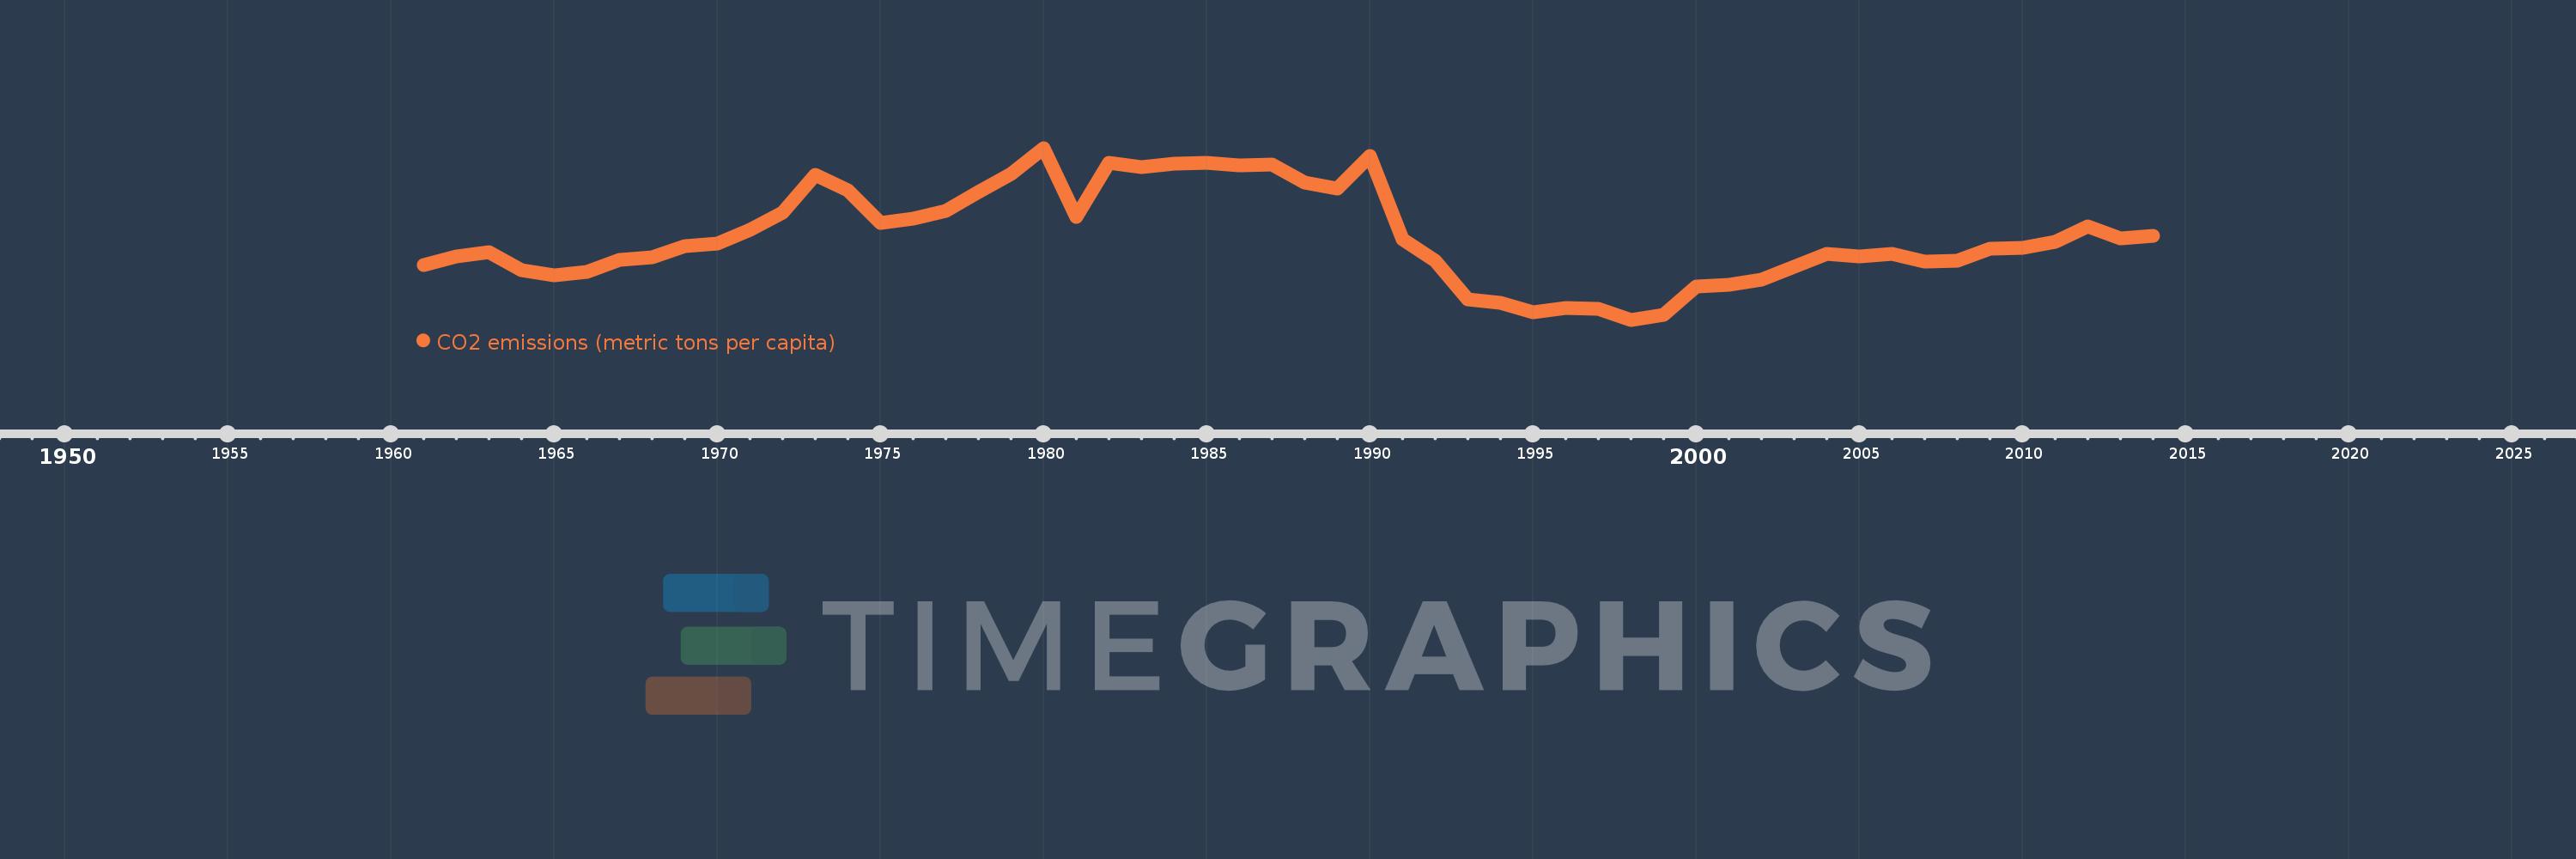
CO2 emissions (metric tons per capita)
2014,2013,2012,2011,2010,2009,2008,2007,2006,2005,2004,2003,2002,2001,2000,1999,1998,1997,1996,1995,1994,1993,1992,1991,1990,1989,1988,1987,1986,1985,1984,1983,1982,1981,1980,1979,1978,1977,1976,1975,1974,1973,1972,1971,1970,1969,1968,1967,1966,1965,1964,1963,1962,1961
This statistics in other country:
AfghanistanAlbaniaAlgeriaAndorraAngolaAntigua and BarbudaArab WorldArgentinaArmeniaArubaAustraliaAustriaAzerbaijanBahamas, TheBahrainBangladeshBarbadosBelarusBelgiumBelizeBeninBermudaBhutanBoliviaBosnia and HerzegovinaBotswanaBrazilBritish Virgin IslandsBrunei DarussalamBulgariaBurkina FasoBurundiCabo VerdeCambodiaCameroonCanadaCaribbean small statesCayman IslandsCentral African RepublicCentral Europe and the BalticsChadChileChinaColombiaComorosCongo, Dem. Rep.Congo, Rep.Costa RicaCote d'IvoireCroatiaCubaCuracaoCyprusCzech RepublicDenmarkDjiboutiDominicaDominican RepublicEarly-demographic dividendEast Asia & PacificEast Asia & Pacific (excluding high income)East Asia & Pacific (IDA & IBRD countries)EcuadorEgypt, Arab Rep.El SalvadorEquatorial GuineaEritreaEstoniaEthiopiaEuro areaEurope & Central AsiaEurope & Central Asia (excluding high income)Europe & Central Asia (IDA & IBRD countries)European UnionFaroe IslandsFijiFinlandFragile and conflict affected situationsFranceFrench PolynesiaGabonGambia, TheGeorgiaGermanyGhanaGibraltarGreeceGreenlandGrenadaGuatemalaGuineaGuinea-BissauGuyanaHaitiHeavily indebted poor countries (HIPC)High incomeHondurasHong Kong SAR, ChinaHungaryIBRD onlyIcelandIDA & IBRD totalIDA blendIDA onlyIDA totalIndiaIndonesiaIran, Islamic Rep.IraqIrelandIsraelItalyJamaicaJapanJordanKazakhstanKenyaKiribatiKorea, Dem. People’s Rep.Korea, Rep.KuwaitKyrgyz RepublicLao PDRLate-demographic dividendLatin America & Caribbean Latin America & Caribbean (excluding high income)Latin America & the Caribbean (IDA & IBRD countries)LatviaLeast developed countries: UN classificationLebanonLesothoLiberiaLibyaLiechtensteinLithuaniaLow & middle incomeLow incomeLower middle incomeLuxembourgMacao SAR, ChinaMacedonia, FYRMadagascarMalawiMalaysiaMaldivesMaliMaltaMarshall IslandsMauritaniaMauritiusMexicoMicronesia, Fed. Sts.Middle East & North AfricaMiddle East & North Africa (excluding high income)Middle East & North Africa (IDA & IBRD countries)Middle incomeMoldovaMongoliaMontenegroMoroccoMozambiqueMyanmarNamibiaNauruNepalNetherlandsNew CaledoniaNew ZealandNicaraguaNigerNigeriaNorth AmericaNorwayOECD membersOmanOther small statesPacific island small statesPakistanPalauPanamaPapua New GuineaParaguayPeruPhilippinesPolandPortugalPost-demographic dividendPre-demographic dividendQatarRomaniaRussian FederationRwandaSamoaSao Tome and PrincipeSaudi ArabiaSenegalSerbiaSeychellesSierra LeoneSingaporeSint Maarten (Dutch part)Slovak RepublicSloveniaSmall statesSolomon IslandsSomaliaSouth AfricaSouth AsiaSouth Asia (IDA & IBRD)South SudanSpainSri LankaSt. Kitts and NevisSt. LuciaSt. Vincent and the GrenadinesSub-Saharan Africa Sub-Saharan Africa (excluding high income)Sub-Saharan Africa (IDA & IBRD countries)SudanSurinameSwazilandSwedenSwitzerlandSyrian Arab RepublicTajikistanTanzaniaThailandTimor-LesteTogoTongaTrinidad and TobagoTunisiaTurkeyTurkmenistanTurks and Caicos IslandsUgandaUkraineUnited Arab EmiratesUnited KingdomUnited StatesUpper middle incomeUruguayUzbekistanVanuatuVenezuela, RBVietnamWest Bank and GazaWorldYemen, Rep.ZambiaZimbabwe Timeline:
This timeline shows a graph from 1961 to 2014 of Albania. No data until 1960. Number of actual observations by date: 54.
Source name:
World Development Indicators
Source organization:
Carbon Dioxide Information Analysis Center, Environmental Sciences Division, Oak Ridge National Laboratory, Tennessee, United States.
Categories, topics:
Climate Change, Environment
Last updated:
apr 23, 2017
Indicators value changes by year
At the date of observation
Value
Absolute change
Change from previous value
jan 1, 1961
1.258
+1.258
0.0%
jan 1, 1962
1.374
+0.116
9.22%
jan 1, 1963
1.44
+0.066
4.79%
jan 1, 1964
1.182
-0.258
-17.94%
jan 1, 1965
1.112
-0.07
-5.92%
jan 1, 1966
1.166
+0.054
4.89%
jan 1, 1967
1.333
+0.167
14.32%
jan 1, 1968
1.364
+0.031
2.3%
jan 1, 1969
1.52
+0.156
11.42%
jan 1, 1970
1.559
+0.039
2.59%
jan 1, 1971
1.753
+0.194
12.46%
jan 1, 1972
1.989
+0.236
13.48%
jan 1, 1973
2.516
+0.526
26.46%
jan 1, 1974
2.304
-0.212
-8.43%
jan 1, 1975
1.849
-0.455
-19.74%
jan 1, 1976
1.911
+0.062
3.33%
jan 1, 1977
2.014
+0.103
5.39%
jan 1, 1978
2.276
+0.262
13.03%
jan 1, 1979
2.531
+0.255
11.19%
jan 1, 1980
2.898
+0.368
14.53%
jan 1, 1981
1.935
-0.963
-33.23%
jan 1, 1982
2.693
+0.758
39.17%
jan 1, 1983
2.625
-0.068
-2.53%
jan 1, 1984
2.683
+0.058
2.22%
jan 1, 1985
2.694
+0.011
0.41%
jan 1, 1986
2.658
-0.036
-1.35%
jan 1, 1987
2.665
+0.007
0.28%
jan 1, 1988
2.414
-0.251
-9.43%
jan 1, 1989
2.332
-0.082
-3.42%
jan 1, 1990
2.783
+0.452
19.37%
jan 1, 1991
1.616
-1.168
-41.95%
jan 1, 1992
1.312
-0.303
-18.78%
jan 1, 1993
0.775
-0.537
-40.96%
jan 1, 1994
0.724
-0.051
-6.57%
jan 1, 1995
0.6
-0.124
-17.07%
jan 1, 1996
0.655
+0.054
9.05%
jan 1, 1997
0.637
-0.018
-2.74%
jan 1, 1998
0.49
-0.146
-22.97%
jan 1, 1999
0.56
+0.07
14.26%
jan 1, 2000
0.96
+0.4
71.37%
jan 1, 2001
0.978
+0.018
1.88%
jan 1, 2002
1.053
+0.075
7.68%
jan 1, 2003
1.23
+0.176
16.73%
jan 1, 2004
1.413
+0.183
14.9%
jan 1, 2005
1.376
-0.036
-2.58%
jan 1, 2006
1.412
+0.036
2.64%
jan 1, 2007
1.303
-0.11
-7.78%
jan 1, 2008
1.322
+0.02
1.52%
jan 1, 2009
1.484
+0.162
12.25%
jan 1, 2010
1.496
+0.011
0.76%
jan 1, 2011
1.579
+0.083
5.55%
jan 1, 2012
1.804
+0.225
14.28%
jan 1, 2013
1.625
-0.179
-9.94%
jan 1, 2014
1.662
+0.037
2.31%
Ranking of countries by current statistics by years


Comments: