29
/
en
AIzaSyAYiBZKx7MnpbEhh9jyipgxe19OcubqV5w
April 1, 2024
279570
Vanuatu
VUT
true
2
1
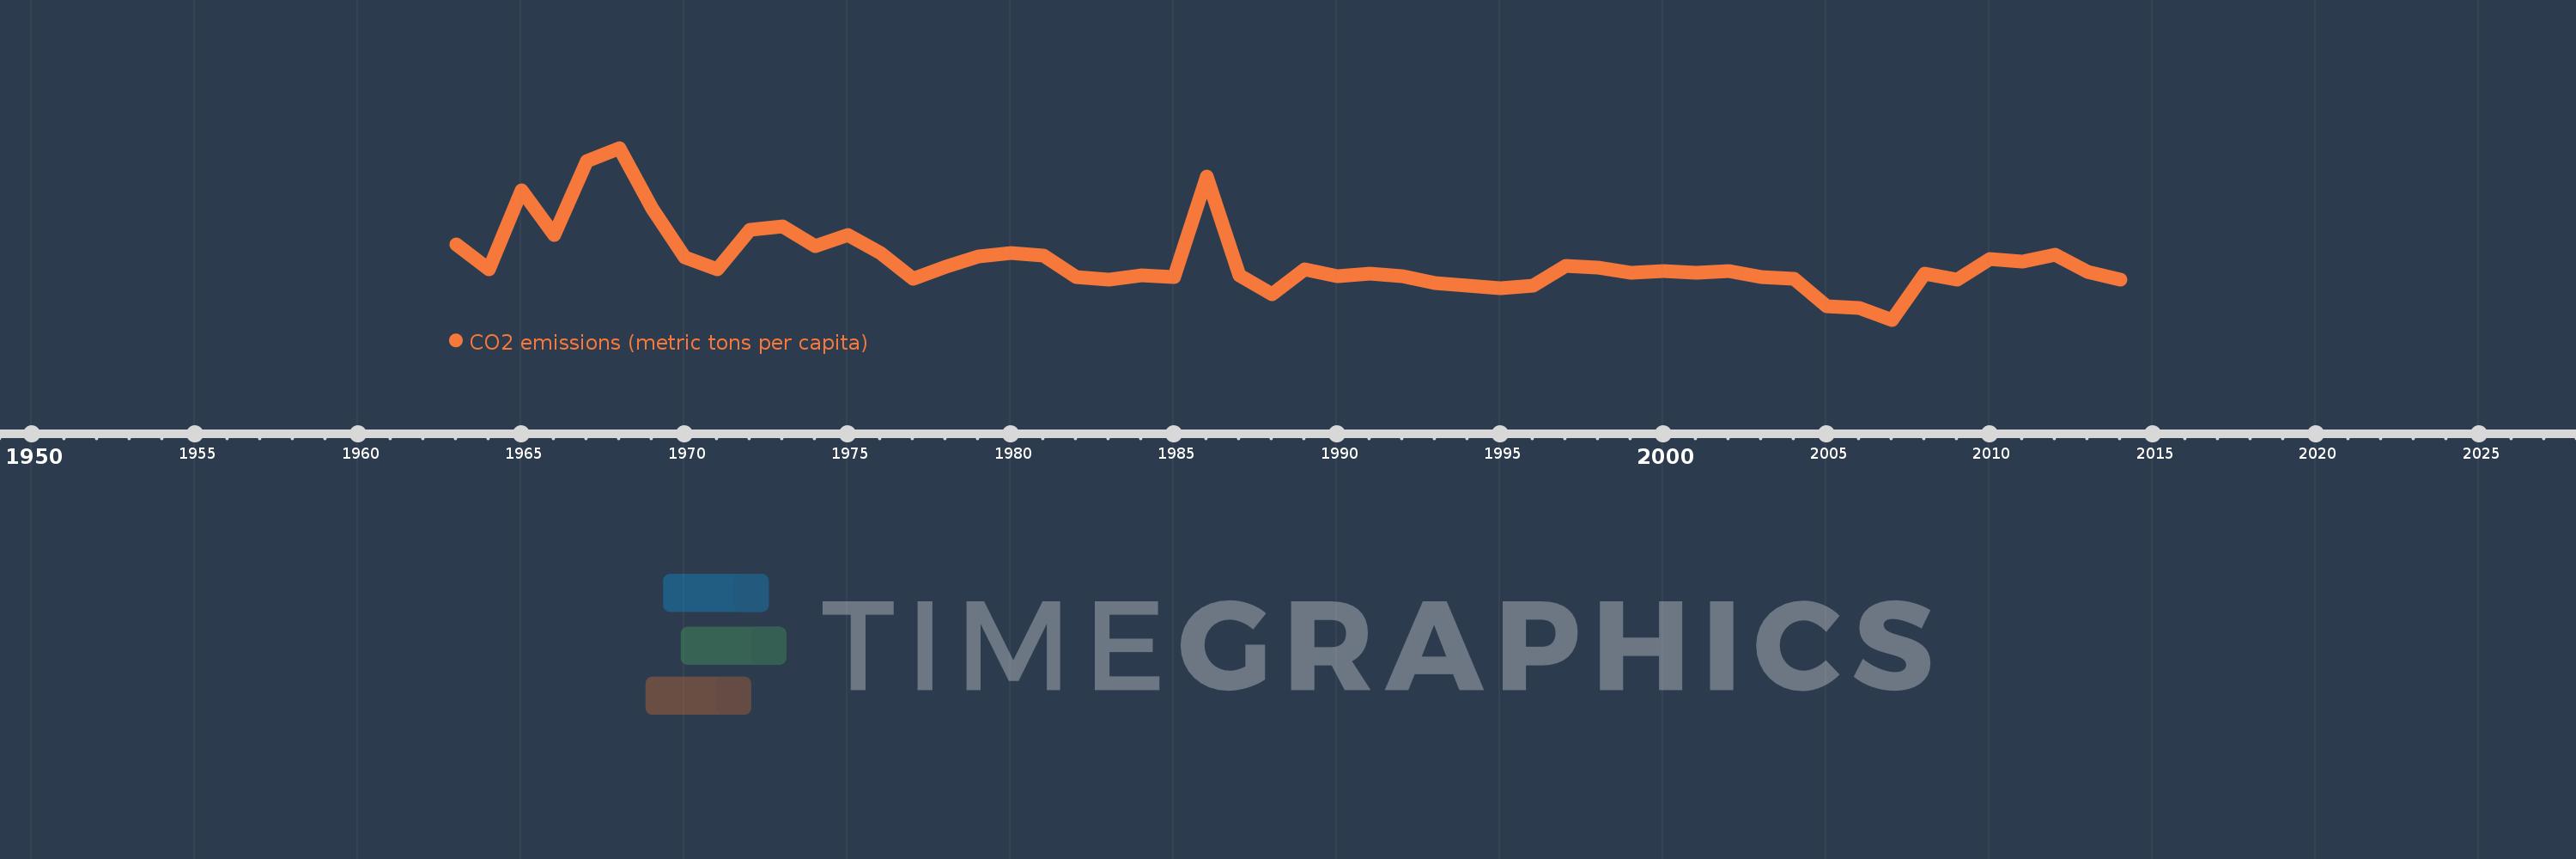
CO2 emissions (metric tons per capita)
2014,2013,2012,2011,2010,2009,2008,2007,2006,2005,2004,2003,2002,2001,2000,1999,1998,1997,1996,1995,1994,1993,1992,1991,1990,1989,1988,1987,1986,1985,1984,1983,1982,1981,1980,1979,1978,1977,1976,1975,1974,1973,1972,1971,1970,1969,1968,1967,1966,1965,1964,1963
This statistics in other country:
AfghanistanAlbaniaAlgeriaAndorraAngolaAntigua and BarbudaArab WorldArgentinaArmeniaArubaAustraliaAustriaAzerbaijanBahamas, TheBahrainBangladeshBarbadosBelarusBelgiumBelizeBeninBermudaBhutanBoliviaBosnia and HerzegovinaBotswanaBrazilBritish Virgin IslandsBrunei DarussalamBulgariaBurkina FasoBurundiCabo VerdeCambodiaCameroonCanadaCaribbean small statesCayman IslandsCentral African RepublicCentral Europe and the BalticsChadChileChinaColombiaComorosCongo, Dem. Rep.Congo, Rep.Costa RicaCote d'IvoireCroatiaCubaCuracaoCyprusCzech RepublicDenmarkDjiboutiDominicaDominican RepublicEarly-demographic dividendEast Asia & PacificEast Asia & Pacific (excluding high income)East Asia & Pacific (IDA & IBRD countries)EcuadorEgypt, Arab Rep.El SalvadorEquatorial GuineaEritreaEstoniaEthiopiaEuro areaEurope & Central AsiaEurope & Central Asia (excluding high income)Europe & Central Asia (IDA & IBRD countries)European UnionFaroe IslandsFijiFinlandFragile and conflict affected situationsFranceFrench PolynesiaGabonGambia, TheGeorgiaGermanyGhanaGibraltarGreeceGreenlandGrenadaGuatemalaGuineaGuinea-BissauGuyanaHaitiHeavily indebted poor countries (HIPC)High incomeHondurasHong Kong SAR, ChinaHungaryIBRD onlyIcelandIDA & IBRD totalIDA blendIDA onlyIDA totalIndiaIndonesiaIran, Islamic Rep.IraqIrelandIsraelItalyJamaicaJapanJordanKazakhstanKenyaKiribatiKorea, Dem. People’s Rep.Korea, Rep.KuwaitKyrgyz RepublicLao PDRLate-demographic dividendLatin America & Caribbean Latin America & Caribbean (excluding high income)Latin America & the Caribbean (IDA & IBRD countries)LatviaLeast developed countries: UN classificationLebanonLesothoLiberiaLibyaLiechtensteinLithuaniaLow & middle incomeLow incomeLower middle incomeLuxembourgMacao SAR, ChinaMacedonia, FYRMadagascarMalawiMalaysiaMaldivesMaliMaltaMarshall IslandsMauritaniaMauritiusMexicoMicronesia, Fed. Sts.Middle East & North AfricaMiddle East & North Africa (excluding high income)Middle East & North Africa (IDA & IBRD countries)Middle incomeMoldovaMongoliaMontenegroMoroccoMozambiqueMyanmarNamibiaNauruNepalNetherlandsNew CaledoniaNew ZealandNicaraguaNigerNigeriaNorth AmericaNorwayOECD membersOmanOther small statesPacific island small statesPakistanPalauPanamaPapua New GuineaParaguayPeruPhilippinesPolandPortugalPost-demographic dividendPre-demographic dividendQatarRomaniaRussian FederationRwandaSamoaSao Tome and PrincipeSaudi ArabiaSenegalSerbiaSeychellesSierra LeoneSingaporeSint Maarten (Dutch part)Slovak RepublicSloveniaSmall statesSolomon IslandsSomaliaSouth AfricaSouth AsiaSouth Asia (IDA & IBRD)South SudanSpainSri LankaSt. Kitts and NevisSt. LuciaSt. Vincent and the GrenadinesSub-Saharan Africa Sub-Saharan Africa (excluding high income)Sub-Saharan Africa (IDA & IBRD countries)SudanSurinameSwazilandSwedenSwitzerlandSyrian Arab RepublicTajikistanTanzaniaThailandTimor-LesteTogoTongaTrinidad and TobagoTunisiaTurkeyTurkmenistanTurks and Caicos IslandsUgandaUkraineUnited Arab EmiratesUnited KingdomUnited StatesUpper middle incomeUruguayUzbekistanVanuatuVenezuela, RBVietnamWest Bank and GazaWorldYemen, Rep.ZambiaZimbabwe Timeline:
This timeline shows a graph from 1963 to 2014 of Vanuatu. No data until 1962. Number of actual observations by date: 52.
Source name:
World Development Indicators
Source organization:
Carbon Dioxide Information Analysis Center, Environmental Sciences Division, Oak Ridge National Laboratory, Tennessee, United States.
Categories, topics:
Climate Change, Environment
Last updated:
apr 23, 2017
Indicators value changes by year
At the date of observation
Value
Absolute change
Change from previous value
jan 1, 1963
0.595
+0.595
0.0%
jan 1, 1964
0.472
-0.123
-20.7%
jan 1, 1965
0.864
+0.393
83.21%
jan 1, 1966
0.642
-0.223
-25.75%
jan 1, 1967
1.008
+0.366
57.05%
jan 1, 1968
1.074
+0.066
6.58%
jan 1, 1969
0.773
-0.301
-28.06%
jan 1, 1970
0.531
-0.242
-31.35%
jan 1, 1971
0.472
-0.058
-10.96%
jan 1, 1972
0.667
+0.194
41.1%
jan 1, 1973
0.686
+0.02
2.97%
jan 1, 1974
0.587
-0.1
-14.53%
jan 1, 1975
0.644
+0.057
9.78%
jan 1, 1976
0.551
-0.093
-14.49%
jan 1, 1977
0.427
-0.124
-22.44%
jan 1, 1978
0.483
+0.056
13.15%
jan 1, 1979
0.536
+0.053
10.94%
jan 1, 1980
0.554
+0.018
3.28%
jan 1, 1981
0.539
-0.015
-2.64%
jan 1, 1982
0.433
-0.106
-19.69%
jan 1, 1983
0.423
-0.01
-2.35%
jan 1, 1984
0.443
+0.02
4.72%
jan 1, 1985
0.433
-0.01
-2.24%
jan 1, 1986
0.931
+0.498
115.04%
jan 1, 1987
0.441
-0.49
-52.61%
jan 1, 1988
0.35
-0.091
-20.59%
jan 1, 1989
0.474
+0.123
35.24%
jan 1, 1990
0.436
-0.037
-7.86%
jan 1, 1991
0.45
+0.014
3.15%
jan 1, 1992
0.438
-0.012
-2.75%
jan 1, 1993
0.402
-0.036
-8.27%
jan 1, 1994
0.39
-0.011
-2.86%
jan 1, 1995
0.38
-0.01
-2.68%
jan 1, 1996
0.392
+0.013
3.35%
jan 1, 1997
0.491
+0.099
25.13%
jan 1, 1998
0.482
-0.009
-1.83%
jan 1, 1999
0.453
-0.029
-6.0%
jan 1, 2000
0.465
+0.012
2.66%
jan 1, 2001
0.456
-0.009
-2.01%
jan 1, 2002
0.465
+0.009
2.02%
jan 1, 2003
0.435
-0.03
-6.47%
jan 1, 2004
0.424
-0.011
-2.52%
jan 1, 2005
0.287
-0.136
-32.2%
jan 1, 2006
0.28
-0.007
-2.5%
jan 1, 2007
0.222
-0.058
-20.74%
jan 1, 2008
0.45
+0.228
102.67%
jan 1, 2009
0.423
-0.027
-6.0%
jan 1, 2010
0.524
+0.101
23.93%
jan 1, 2011
0.512
-0.012
-2.33%
jan 1, 2012
0.546
+0.034
6.58%
jan 1, 2013
0.459
-0.086
-15.84%
jan 1, 2014
0.42
-0.039
-8.55%
Ranking of countries by current statistics by years


Comments: