29
/
en
AIzaSyAYiBZKx7MnpbEhh9jyipgxe19OcubqV5w
April 1, 2024
111988
Costa Rica
CRI
true
2
1
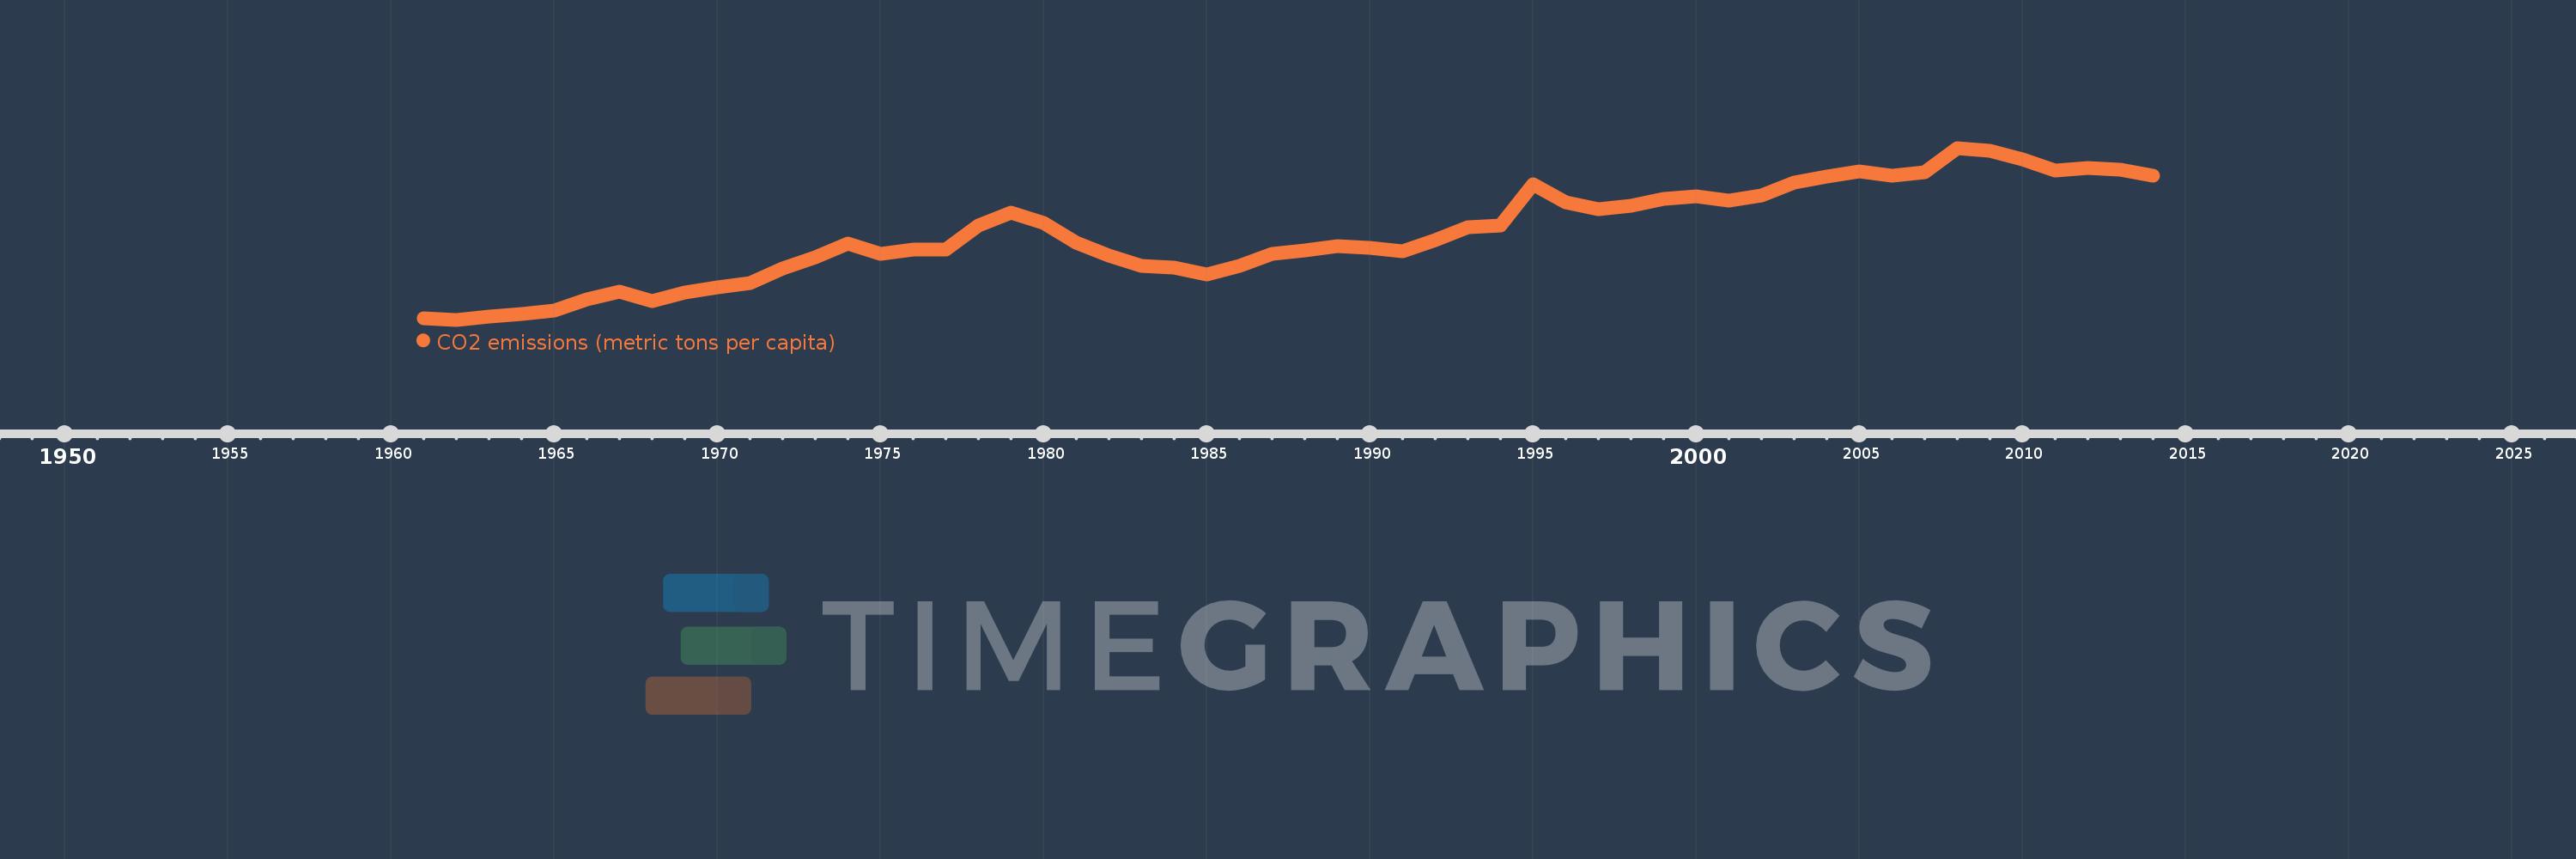
CO2 emissions (metric tons per capita)
2014,2013,2012,2011,2010,2009,2008,2007,2006,2005,2004,2003,2002,2001,2000,1999,1998,1997,1996,1995,1994,1993,1992,1991,1990,1989,1988,1987,1986,1985,1984,1983,1982,1981,1980,1979,1978,1977,1976,1975,1974,1973,1972,1971,1970,1969,1968,1967,1966,1965,1964,1963,1962,1961
This statistics in other country:
AfghanistanAlbaniaAlgeriaAndorraAngolaAntigua and BarbudaArab WorldArgentinaArmeniaArubaAustraliaAustriaAzerbaijanBahamas, TheBahrainBangladeshBarbadosBelarusBelgiumBelizeBeninBermudaBhutanBoliviaBosnia and HerzegovinaBotswanaBrazilBritish Virgin IslandsBrunei DarussalamBulgariaBurkina FasoBurundiCabo VerdeCambodiaCameroonCanadaCaribbean small statesCayman IslandsCentral African RepublicCentral Europe and the BalticsChadChileChinaColombiaComorosCongo, Dem. Rep.Congo, Rep.Costa RicaCote d'IvoireCroatiaCubaCuracaoCyprusCzech RepublicDenmarkDjiboutiDominicaDominican RepublicEarly-demographic dividendEast Asia & PacificEast Asia & Pacific (excluding high income)East Asia & Pacific (IDA & IBRD countries)EcuadorEgypt, Arab Rep.El SalvadorEquatorial GuineaEritreaEstoniaEthiopiaEuro areaEurope & Central AsiaEurope & Central Asia (excluding high income)Europe & Central Asia (IDA & IBRD countries)European UnionFaroe IslandsFijiFinlandFragile and conflict affected situationsFranceFrench PolynesiaGabonGambia, TheGeorgiaGermanyGhanaGibraltarGreeceGreenlandGrenadaGuatemalaGuineaGuinea-BissauGuyanaHaitiHeavily indebted poor countries (HIPC)High incomeHondurasHong Kong SAR, ChinaHungaryIBRD onlyIcelandIDA & IBRD totalIDA blendIDA onlyIDA totalIndiaIndonesiaIran, Islamic Rep.IraqIrelandIsraelItalyJamaicaJapanJordanKazakhstanKenyaKiribatiKorea, Dem. People’s Rep.Korea, Rep.KuwaitKyrgyz RepublicLao PDRLate-demographic dividendLatin America & Caribbean Latin America & Caribbean (excluding high income)Latin America & the Caribbean (IDA & IBRD countries)LatviaLeast developed countries: UN classificationLebanonLesothoLiberiaLibyaLiechtensteinLithuaniaLow & middle incomeLow incomeLower middle incomeLuxembourgMacao SAR, ChinaMacedonia, FYRMadagascarMalawiMalaysiaMaldivesMaliMaltaMarshall IslandsMauritaniaMauritiusMexicoMicronesia, Fed. Sts.Middle East & North AfricaMiddle East & North Africa (excluding high income)Middle East & North Africa (IDA & IBRD countries)Middle incomeMoldovaMongoliaMontenegroMoroccoMozambiqueMyanmarNamibiaNauruNepalNetherlandsNew CaledoniaNew ZealandNicaraguaNigerNigeriaNorth AmericaNorwayOECD membersOmanOther small statesPacific island small statesPakistanPalauPanamaPapua New GuineaParaguayPeruPhilippinesPolandPortugalPost-demographic dividendPre-demographic dividendQatarRomaniaRussian FederationRwandaSamoaSao Tome and PrincipeSaudi ArabiaSenegalSerbiaSeychellesSierra LeoneSingaporeSint Maarten (Dutch part)Slovak RepublicSloveniaSmall statesSolomon IslandsSomaliaSouth AfricaSouth AsiaSouth Asia (IDA & IBRD)South SudanSpainSri LankaSt. Kitts and NevisSt. LuciaSt. Vincent and the GrenadinesSub-Saharan Africa Sub-Saharan Africa (excluding high income)Sub-Saharan Africa (IDA & IBRD countries)SudanSurinameSwazilandSwedenSwitzerlandSyrian Arab RepublicTajikistanTanzaniaThailandTimor-LesteTogoTongaTrinidad and TobagoTunisiaTurkeyTurkmenistanTurks and Caicos IslandsUgandaUkraineUnited Arab EmiratesUnited KingdomUnited StatesUpper middle incomeUruguayUzbekistanVanuatuVenezuela, RBVietnamWest Bank and GazaWorldYemen, Rep.ZambiaZimbabwe Timeline:
This timeline shows a graph from 1961 to 2014 of Costa Rica. No data until 1960. Number of actual observations by date: 54.
Source name:
World Development Indicators
Source organization:
Carbon Dioxide Information Analysis Center, Environmental Sciences Division, Oak Ridge National Laboratory, Tennessee, United States.
Categories, topics:
Climate Change, Environment
Last updated:
apr 23, 2017
Indicators value changes by year
At the date of observation
Value
Absolute change
Change from previous value
jan 1, 1961
0.369
+0.369
0.0%
jan 1, 1962
0.356
-0.013
-3.54%
jan 1, 1963
0.384
+0.028
7.98%
jan 1, 1964
0.405
+0.021
5.51%
jan 1, 1965
0.439
+0.034
8.36%
jan 1, 1966
0.533
+0.094
21.39%
jan 1, 1967
0.605
+0.072
13.56%
jan 1, 1968
0.517
-0.088
-14.54%
jan 1, 1969
0.594
+0.077
14.87%
jan 1, 1970
0.638
+0.044
7.44%
jan 1, 1971
0.676
+0.038
5.97%
jan 1, 1972
0.806
+0.129
19.1%
jan 1, 1973
0.906
+0.1
12.46%
jan 1, 1974
1.025
+0.119
13.18%
jan 1, 1975
0.932
-0.093
-9.08%
jan 1, 1976
0.972
+0.04
4.28%
jan 1, 1977
0.97
-0.002
-0.23%
jan 1, 1978
1.184
+0.214
22.12%
jan 1, 1979
1.29
+0.105
8.9%
jan 1, 1980
1.201
-0.089
-6.88%
jan 1, 1981
1.031
-0.17
-14.12%
jan 1, 1982
0.917
-0.114
-11.04%
jan 1, 1983
0.828
-0.09
-9.79%
jan 1, 1984
0.813
-0.015
-1.8%
jan 1, 1985
0.753
-0.06
-7.38%
jan 1, 1986
0.83
+0.077
10.27%
jan 1, 1987
0.931
+0.101
12.14%
jan 1, 1988
0.96
+0.029
3.14%
jan 1, 1989
0.999
+0.039
4.03%
jan 1, 1990
0.985
-0.014
-1.37%
jan 1, 1991
0.955
-0.03
-3.09%
jan 1, 1992
1.051
+0.096
10.07%
jan 1, 1993
1.164
+0.113
10.77%
jan 1, 1994
1.183
+0.019
1.65%
jan 1, 1995
1.538
+0.355
30.01%
jan 1, 1996
1.386
-0.152
-9.9%
jan 1, 1997
1.32
-0.066
-4.74%
jan 1, 1998
1.354
+0.034
2.57%
jan 1, 1999
1.411
+0.057
4.22%
jan 1, 2000
1.435
+0.024
1.67%
jan 1, 2001
1.395
-0.04
-2.8%
jan 1, 2002
1.441
+0.047
3.35%
jan 1, 2003
1.557
+0.115
8.01%
jan 1, 2004
1.606
+0.049
3.16%
jan 1, 2005
1.655
+0.049
3.07%
jan 1, 2006
1.617
-0.038
-2.32%
jan 1, 2007
1.648
+0.031
1.9%
jan 1, 2008
1.859
+0.211
12.82%
jan 1, 2009
1.835
-0.024
-1.27%
jan 1, 2010
1.761
-0.075
-4.07%
jan 1, 2011
1.665
-0.096
-5.42%
jan 1, 2012
1.683
+0.017
1.05%
jan 1, 2013
1.669
-0.014
-0.83%
jan 1, 2014
1.618
-0.05
-3.03%
Ranking of countries by current statistics by years


Comments: