29
/
en
AIzaSyAYiBZKx7MnpbEhh9jyipgxe19OcubqV5w
April 1, 2024
148913
Haiti
HTI
true
2
1
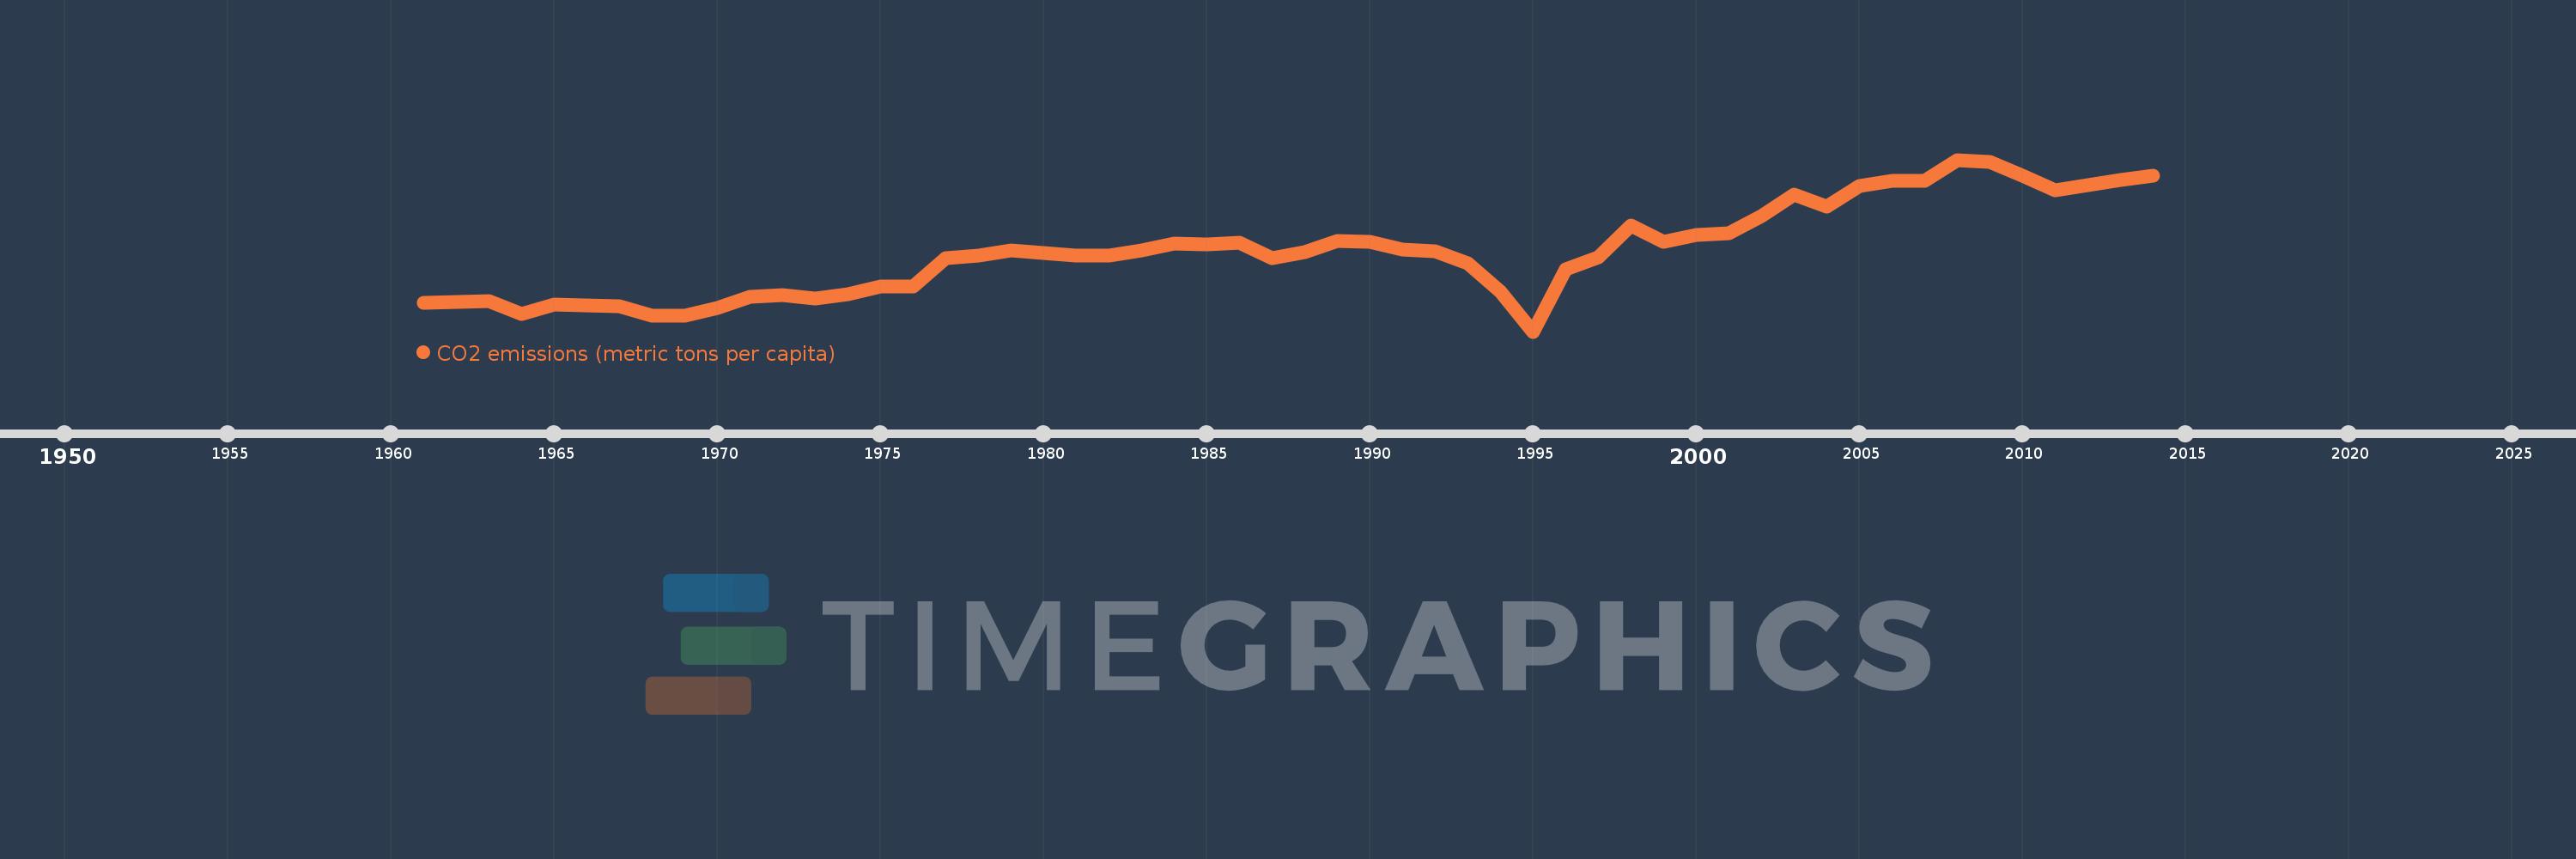
CO2 emissions (metric tons per capita)
2014,2013,2012,2011,2010,2009,2008,2007,2006,2005,2004,2003,2002,2001,2000,1999,1998,1997,1996,1995,1994,1993,1992,1991,1990,1989,1988,1987,1986,1985,1984,1983,1982,1981,1980,1979,1978,1977,1976,1975,1974,1973,1972,1971,1970,1969,1968,1967,1966,1965,1964,1963,1962,1961
This statistics in other country:
AfghanistanAlbaniaAlgeriaAndorraAngolaAntigua and BarbudaArab WorldArgentinaArmeniaArubaAustraliaAustriaAzerbaijanBahamas, TheBahrainBangladeshBarbadosBelarusBelgiumBelizeBeninBermudaBhutanBoliviaBosnia and HerzegovinaBotswanaBrazilBritish Virgin IslandsBrunei DarussalamBulgariaBurkina FasoBurundiCabo VerdeCambodiaCameroonCanadaCaribbean small statesCayman IslandsCentral African RepublicCentral Europe and the BalticsChadChileChinaColombiaComorosCongo, Dem. Rep.Congo, Rep.Costa RicaCote d'IvoireCroatiaCubaCuracaoCyprusCzech RepublicDenmarkDjiboutiDominicaDominican RepublicEarly-demographic dividendEast Asia & PacificEast Asia & Pacific (excluding high income)East Asia & Pacific (IDA & IBRD countries)EcuadorEgypt, Arab Rep.El SalvadorEquatorial GuineaEritreaEstoniaEthiopiaEuro areaEurope & Central AsiaEurope & Central Asia (excluding high income)Europe & Central Asia (IDA & IBRD countries)European UnionFaroe IslandsFijiFinlandFragile and conflict affected situationsFranceFrench PolynesiaGabonGambia, TheGeorgiaGermanyGhanaGibraltarGreeceGreenlandGrenadaGuatemalaGuineaGuinea-BissauGuyanaHaitiHeavily indebted poor countries (HIPC)High incomeHondurasHong Kong SAR, ChinaHungaryIBRD onlyIcelandIDA & IBRD totalIDA blendIDA onlyIDA totalIndiaIndonesiaIran, Islamic Rep.IraqIrelandIsraelItalyJamaicaJapanJordanKazakhstanKenyaKiribatiKorea, Dem. People’s Rep.Korea, Rep.KuwaitKyrgyz RepublicLao PDRLate-demographic dividendLatin America & Caribbean Latin America & Caribbean (excluding high income)Latin America & the Caribbean (IDA & IBRD countries)LatviaLeast developed countries: UN classificationLebanonLesothoLiberiaLibyaLiechtensteinLithuaniaLow & middle incomeLow incomeLower middle incomeLuxembourgMacao SAR, ChinaMacedonia, FYRMadagascarMalawiMalaysiaMaldivesMaliMaltaMarshall IslandsMauritaniaMauritiusMexicoMicronesia, Fed. Sts.Middle East & North AfricaMiddle East & North Africa (excluding high income)Middle East & North Africa (IDA & IBRD countries)Middle incomeMoldovaMongoliaMontenegroMoroccoMozambiqueMyanmarNamibiaNauruNepalNetherlandsNew CaledoniaNew ZealandNicaraguaNigerNigeriaNorth AmericaNorwayOECD membersOmanOther small statesPacific island small statesPakistanPalauPanamaPapua New GuineaParaguayPeruPhilippinesPolandPortugalPost-demographic dividendPre-demographic dividendQatarRomaniaRussian FederationRwandaSamoaSao Tome and PrincipeSaudi ArabiaSenegalSerbiaSeychellesSierra LeoneSingaporeSint Maarten (Dutch part)Slovak RepublicSloveniaSmall statesSolomon IslandsSomaliaSouth AfricaSouth AsiaSouth Asia (IDA & IBRD)South SudanSpainSri LankaSt. Kitts and NevisSt. LuciaSt. Vincent and the GrenadinesSub-Saharan Africa Sub-Saharan Africa (excluding high income)Sub-Saharan Africa (IDA & IBRD countries)SudanSurinameSwazilandSwedenSwitzerlandSyrian Arab RepublicTajikistanTanzaniaThailandTimor-LesteTogoTongaTrinidad and TobagoTunisiaTurkeyTurkmenistanTurks and Caicos IslandsUgandaUkraineUnited Arab EmiratesUnited KingdomUnited StatesUpper middle incomeUruguayUzbekistanVanuatuVenezuela, RBVietnamWest Bank and GazaWorldYemen, Rep.ZambiaZimbabwe Timeline:
This timeline shows a graph from 1961 to 2014 of Haiti. No data until 1960. Number of actual observations by date: 54.
Source name:
World Development Indicators
Source organization:
Carbon Dioxide Information Analysis Center, Environmental Sciences Division, Oak Ridge National Laboratory, Tennessee, United States.
Categories, topics:
Climate Change, Environment
Last updated:
apr 23, 2017
Indicators value changes by year
At the date of observation
Value
Absolute change
Change from previous value
jan 1, 1961
0.074
+0.074
0.0%
jan 1, 1962
0.075
+0.001
1.81%
jan 1, 1963
0.076
+0.0
0.45%
jan 1, 1964
0.061
-0.015
-19.69%
jan 1, 1965
0.072
+0.011
18.2%
jan 1, 1966
0.071
-0.001
-0.78%
jan 1, 1967
0.07
-0.001
-1.98%
jan 1, 1968
0.059
-0.011
-16.15%
jan 1, 1969
0.058
0.0
-0.58%
jan 1, 1970
0.068
+0.01
17.17%
jan 1, 1971
0.082
+0.014
19.85%
jan 1, 1972
0.084
+0.002
2.91%
jan 1, 1973
0.08
-0.004
-4.39%
jan 1, 1974
0.085
+0.005
5.65%
jan 1, 1975
0.094
+0.009
10.23%
jan 1, 1976
0.094
+0.0
0.49%
jan 1, 1977
0.129
+0.035
36.79%
jan 1, 1978
0.132
+0.004
2.87%
jan 1, 1979
0.139
+0.006
4.6%
jan 1, 1980
0.136
-0.003
-2.08%
jan 1, 1981
0.132
-0.004
-2.63%
jan 1, 1982
0.132
0.0
-0.32%
jan 1, 1983
0.139
+0.007
5.19%
jan 1, 1984
0.147
+0.008
5.93%
jan 1, 1985
0.146
0.0
-0.3%
jan 1, 1986
0.148
+0.001
0.89%
jan 1, 1987
0.129
-0.018
-12.47%
jan 1, 1988
0.137
+0.008
5.94%
jan 1, 1989
0.15
+0.013
9.7%
jan 1, 1990
0.149
-0.001
-0.65%
jan 1, 1991
0.14
-0.009
-6.17%
jan 1, 1992
0.138
-0.002
-1.62%
jan 1, 1993
0.123
-0.015
-10.6%
jan 1, 1994
0.088
-0.035
-28.41%
jan 1, 1995
0.039
-0.049
-55.55%
jan 1, 1996
0.115
+0.076
194.44%
jan 1, 1997
0.13
+0.014
12.54%
jan 1, 1998
0.169
+0.039
29.88%
jan 1, 1999
0.149
-0.019
-11.52%
jan 1, 2000
0.158
+0.009
6.16%
jan 1, 2001
0.16
+0.002
1.01%
jan 1, 2002
0.181
+0.021
12.85%
jan 1, 2003
0.207
+0.026
14.48%
jan 1, 2004
0.193
-0.013
-6.52%
jan 1, 2005
0.218
+0.025
12.8%
jan 1, 2006
0.224
+0.006
2.8%
jan 1, 2007
0.224
+0.0
0.19%
jan 1, 2008
0.25
+0.026
11.45%
jan 1, 2009
0.247
-0.003
-1.22%
jan 1, 2010
0.23
-0.017
-6.77%
jan 1, 2011
0.213
-0.018
-7.67%
jan 1, 2012
0.219
+0.006
2.82%
jan 1, 2013
0.225
+0.007
3.0%
jan 1, 2014
0.231
+0.005
2.38%
Ranking of countries by current statistics by years


Comments: