29
/
en
AIzaSyAYiBZKx7MnpbEhh9jyipgxe19OcubqV5w
April 1, 2024
33283
European Union
EUU
false
2
1
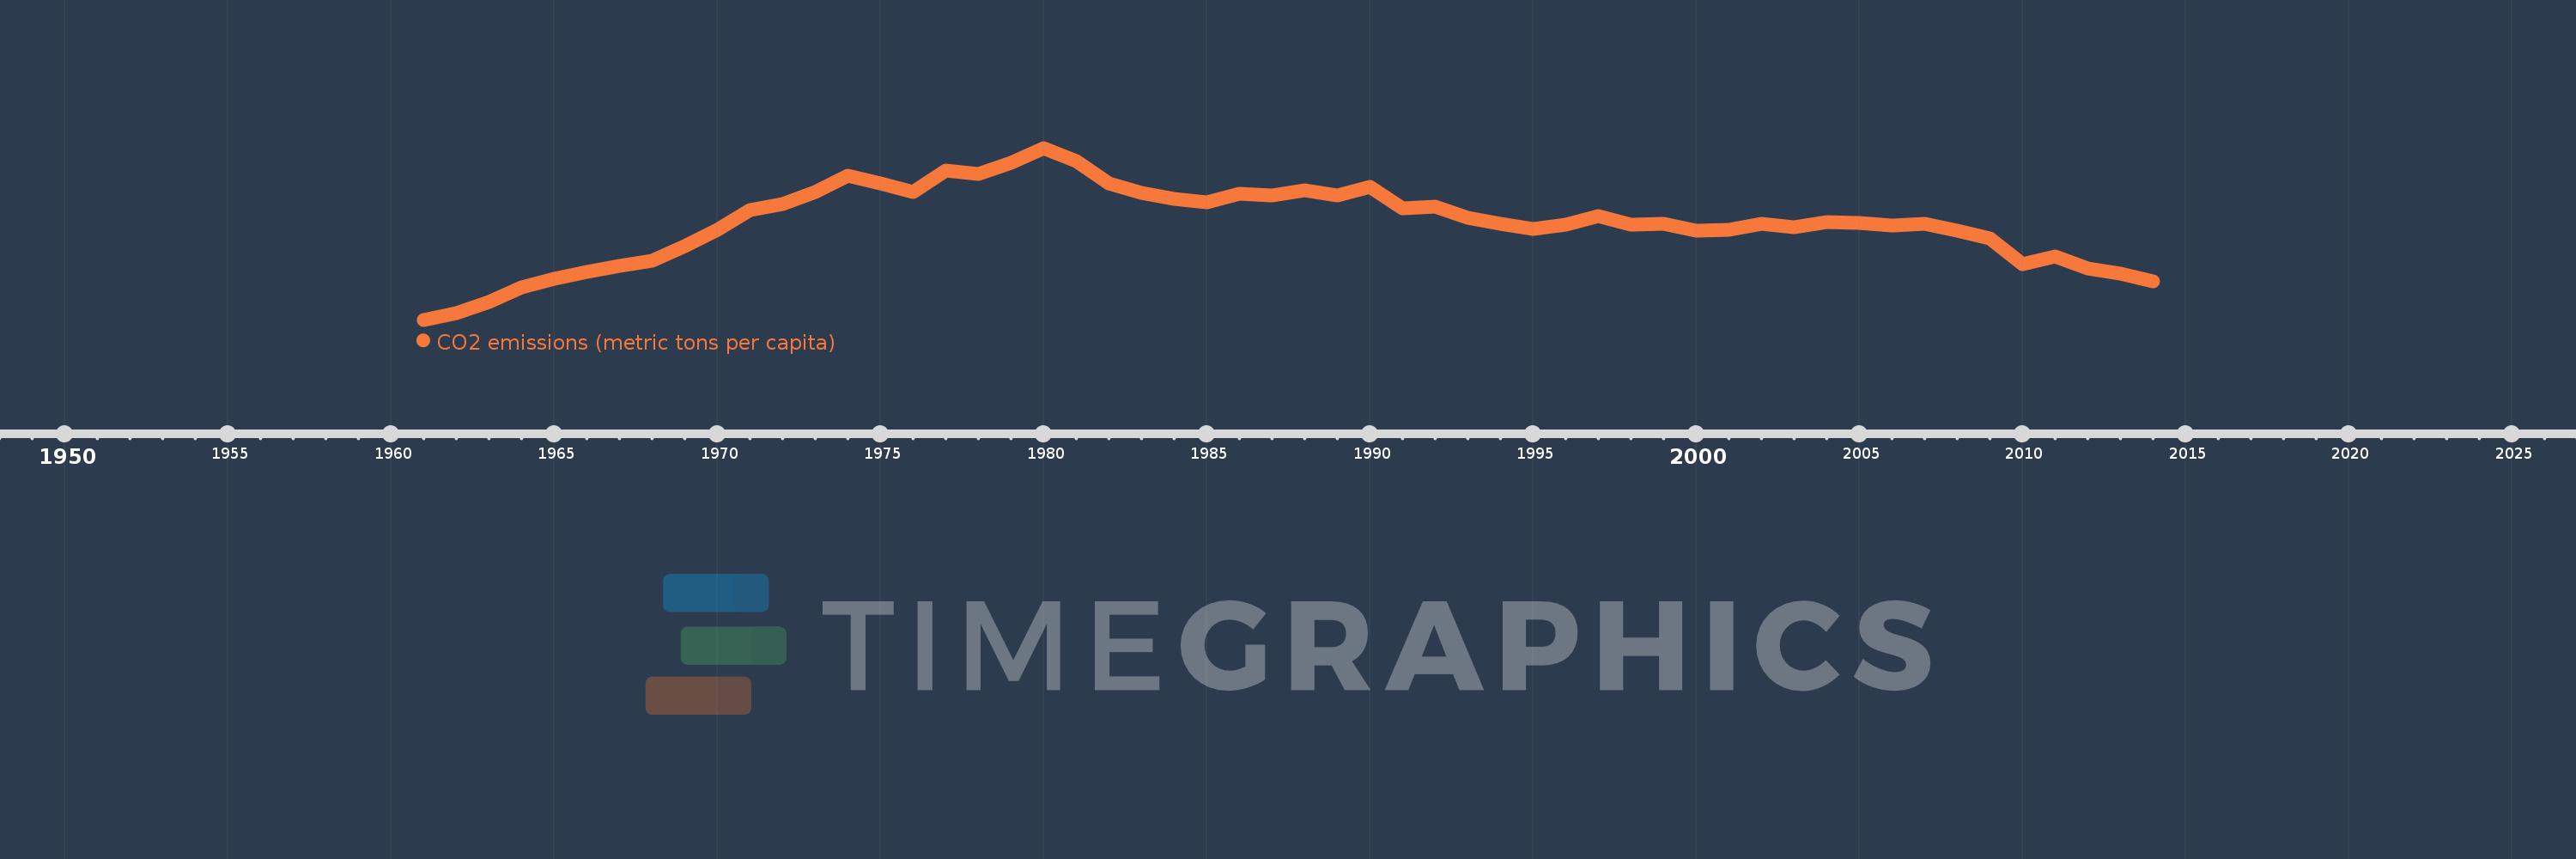
CO2 emissions (metric tons per capita)
2014,2013,2012,2011,2010,2009,2008,2007,2006,2005,2004,2003,2002,2001,2000,1999,1998,1997,1996,1995,1994,1993,1992,1991,1990,1989,1988,1987,1986,1985,1984,1983,1982,1981,1980,1979,1978,1977,1976,1975,1974,1973,1972,1971,1970,1969,1968,1967,1966,1965,1964,1963,1962,1961
This statistics in other country:
AfghanistanAlbaniaAlgeriaAndorraAngolaAntigua and BarbudaArab WorldArgentinaArmeniaArubaAustraliaAustriaAzerbaijanBahamas, TheBahrainBangladeshBarbadosBelarusBelgiumBelizeBeninBermudaBhutanBoliviaBosnia and HerzegovinaBotswanaBrazilBritish Virgin IslandsBrunei DarussalamBulgariaBurkina FasoBurundiCabo VerdeCambodiaCameroonCanadaCaribbean small statesCayman IslandsCentral African RepublicCentral Europe and the BalticsChadChileChinaColombiaComorosCongo, Dem. Rep.Congo, Rep.Costa RicaCote d'IvoireCroatiaCubaCuracaoCyprusCzech RepublicDenmarkDjiboutiDominicaDominican RepublicEarly-demographic dividendEast Asia & PacificEast Asia & Pacific (excluding high income)East Asia & Pacific (IDA & IBRD countries)EcuadorEgypt, Arab Rep.El SalvadorEquatorial GuineaEritreaEstoniaEthiopiaEuro areaEurope & Central AsiaEurope & Central Asia (excluding high income)Europe & Central Asia (IDA & IBRD countries)European UnionFaroe IslandsFijiFinlandFragile and conflict affected situationsFranceFrench PolynesiaGabonGambia, TheGeorgiaGermanyGhanaGibraltarGreeceGreenlandGrenadaGuatemalaGuineaGuinea-BissauGuyanaHaitiHeavily indebted poor countries (HIPC)High incomeHondurasHong Kong SAR, ChinaHungaryIBRD onlyIcelandIDA & IBRD totalIDA blendIDA onlyIDA totalIndiaIndonesiaIran, Islamic Rep.IraqIrelandIsraelItalyJamaicaJapanJordanKazakhstanKenyaKiribatiKorea, Dem. People’s Rep.Korea, Rep.KuwaitKyrgyz RepublicLao PDRLate-demographic dividendLatin America & Caribbean Latin America & Caribbean (excluding high income)Latin America & the Caribbean (IDA & IBRD countries)LatviaLeast developed countries: UN classificationLebanonLesothoLiberiaLibyaLiechtensteinLithuaniaLow & middle incomeLow incomeLower middle incomeLuxembourgMacao SAR, ChinaMacedonia, FYRMadagascarMalawiMalaysiaMaldivesMaliMaltaMarshall IslandsMauritaniaMauritiusMexicoMicronesia, Fed. Sts.Middle East & North AfricaMiddle East & North Africa (excluding high income)Middle East & North Africa (IDA & IBRD countries)Middle incomeMoldovaMongoliaMontenegroMoroccoMozambiqueMyanmarNamibiaNauruNepalNetherlandsNew CaledoniaNew ZealandNicaraguaNigerNigeriaNorth AmericaNorwayOECD membersOmanOther small statesPacific island small statesPakistanPalauPanamaPapua New GuineaParaguayPeruPhilippinesPolandPortugalPost-demographic dividendPre-demographic dividendQatarRomaniaRussian FederationRwandaSamoaSao Tome and PrincipeSaudi ArabiaSenegalSerbiaSeychellesSierra LeoneSingaporeSint Maarten (Dutch part)Slovak RepublicSloveniaSmall statesSolomon IslandsSomaliaSouth AfricaSouth AsiaSouth Asia (IDA & IBRD)South SudanSpainSri LankaSt. Kitts and NevisSt. LuciaSt. Vincent and the GrenadinesSub-Saharan Africa Sub-Saharan Africa (excluding high income)Sub-Saharan Africa (IDA & IBRD countries)SudanSurinameSwazilandSwedenSwitzerlandSyrian Arab RepublicTajikistanTanzaniaThailandTimor-LesteTogoTongaTrinidad and TobagoTunisiaTurkeyTurkmenistanTurks and Caicos IslandsUgandaUkraineUnited Arab EmiratesUnited KingdomUnited StatesUpper middle incomeUruguayUzbekistanVanuatuVenezuela, RBVietnamWest Bank and GazaWorldYemen, Rep.ZambiaZimbabwe Timeline:
This timeline shows a graph from 1961 to 2014 of European Union. No data until 1960. Number of actual observations by date: 54.
Source name:
World Development Indicators
Source organization:
Carbon Dioxide Information Analysis Center, Environmental Sciences Division, Oak Ridge National Laboratory, Tennessee, United States.
Categories, topics:
Climate Change, Environment
Last updated:
apr 23, 2017
Indicators value changes by year
Maximum:
10.052
jan 1, 1980
At the date of observation
Value
Absolute change
Change from previous value
jan 1, 1961
5.764
+5.764
0.0%
jan 1, 1962
5.924
+0.16
2.78%
jan 1, 1963
6.211
+0.287
4.85%
jan 1, 1964
6.576
+0.365
5.87%
jan 1, 1965
6.792
+0.216
3.29%
jan 1, 1966
6.964
+0.172
2.53%
jan 1, 1967
7.118
+0.154
2.21%
jan 1, 1968
7.227
+0.109
1.53%
jan 1, 1969
7.595
+0.368
5.09%
jan 1, 1970
8.009
+0.414
5.45%
jan 1, 1971
8.493
+0.485
6.05%
jan 1, 1972
8.659
+0.166
1.95%
jan 1, 1973
8.947
+0.288
3.32%
jan 1, 1974
9.349
+0.402
4.49%
jan 1, 1975
9.163
-0.186
-1.99%
jan 1, 1976
8.945
-0.219
-2.39%
jan 1, 1977
9.485
+0.541
6.04%
jan 1, 1978
9.411
-0.074
-0.78%
jan 1, 1979
9.678
+0.268
2.84%
jan 1, 1980
10.052
+0.374
3.86%
jan 1, 1981
9.734
-0.318
-3.17%
jan 1, 1982
9.156
-0.578
-5.94%
jan 1, 1983
8.929
-0.226
-2.47%
jan 1, 1984
8.781
-0.148
-1.66%
jan 1, 1985
8.703
-0.078
-0.89%
jan 1, 1986
8.905
+0.202
2.32%
jan 1, 1987
8.86
-0.046
-0.51%
jan 1, 1988
9.002
+0.143
1.61%
jan 1, 1989
8.856
-0.147
-1.63%
jan 1, 1990
9.078
+0.223
2.51%
jan 1, 1991
8.54
-0.538
-5.93%
jan 1, 1992
8.583
+0.043
0.5%
jan 1, 1993
8.305
-0.278
-3.24%
jan 1, 1994
8.164
-0.141
-1.69%
jan 1, 1995
8.036
-0.128
-1.57%
jan 1, 1996
8.139
+0.103
1.28%
jan 1, 1997
8.351
+0.212
2.6%
jan 1, 1998
8.146
-0.204
-2.44%
jan 1, 1999
8.15
+0.004
0.05%
jan 1, 2000
7.979
-0.171
-2.1%
jan 1, 2001
8.001
+0.022
0.28%
jan 1, 2002
8.156
+0.154
1.93%
jan 1, 2003
8.083
-0.073
-0.89%
jan 1, 2004
8.206
+0.123
1.52%
jan 1, 2005
8.19
-0.016
-0.2%
jan 1, 2006
8.119
-0.071
-0.87%
jan 1, 2007
8.15
+0.031
0.38%
jan 1, 2008
7.996
-0.153
-1.88%
jan 1, 2009
7.792
-0.204
-2.55%
jan 1, 2010
7.149
-0.643
-8.25%
jan 1, 2011
7.346
+0.197
2.75%
jan 1, 2012
7.054
-0.291
-3.97%
jan 1, 2013
6.906
-0.148
-2.1%
jan 1, 2014
6.715
-0.192
-2.77%
Ranking of countries by current statistics by years


Comments: