29
/
en
AIzaSyAYiBZKx7MnpbEhh9jyipgxe19OcubqV5w
April 1, 2024
68649
Antigua and Barbuda
ATG
true
2
1
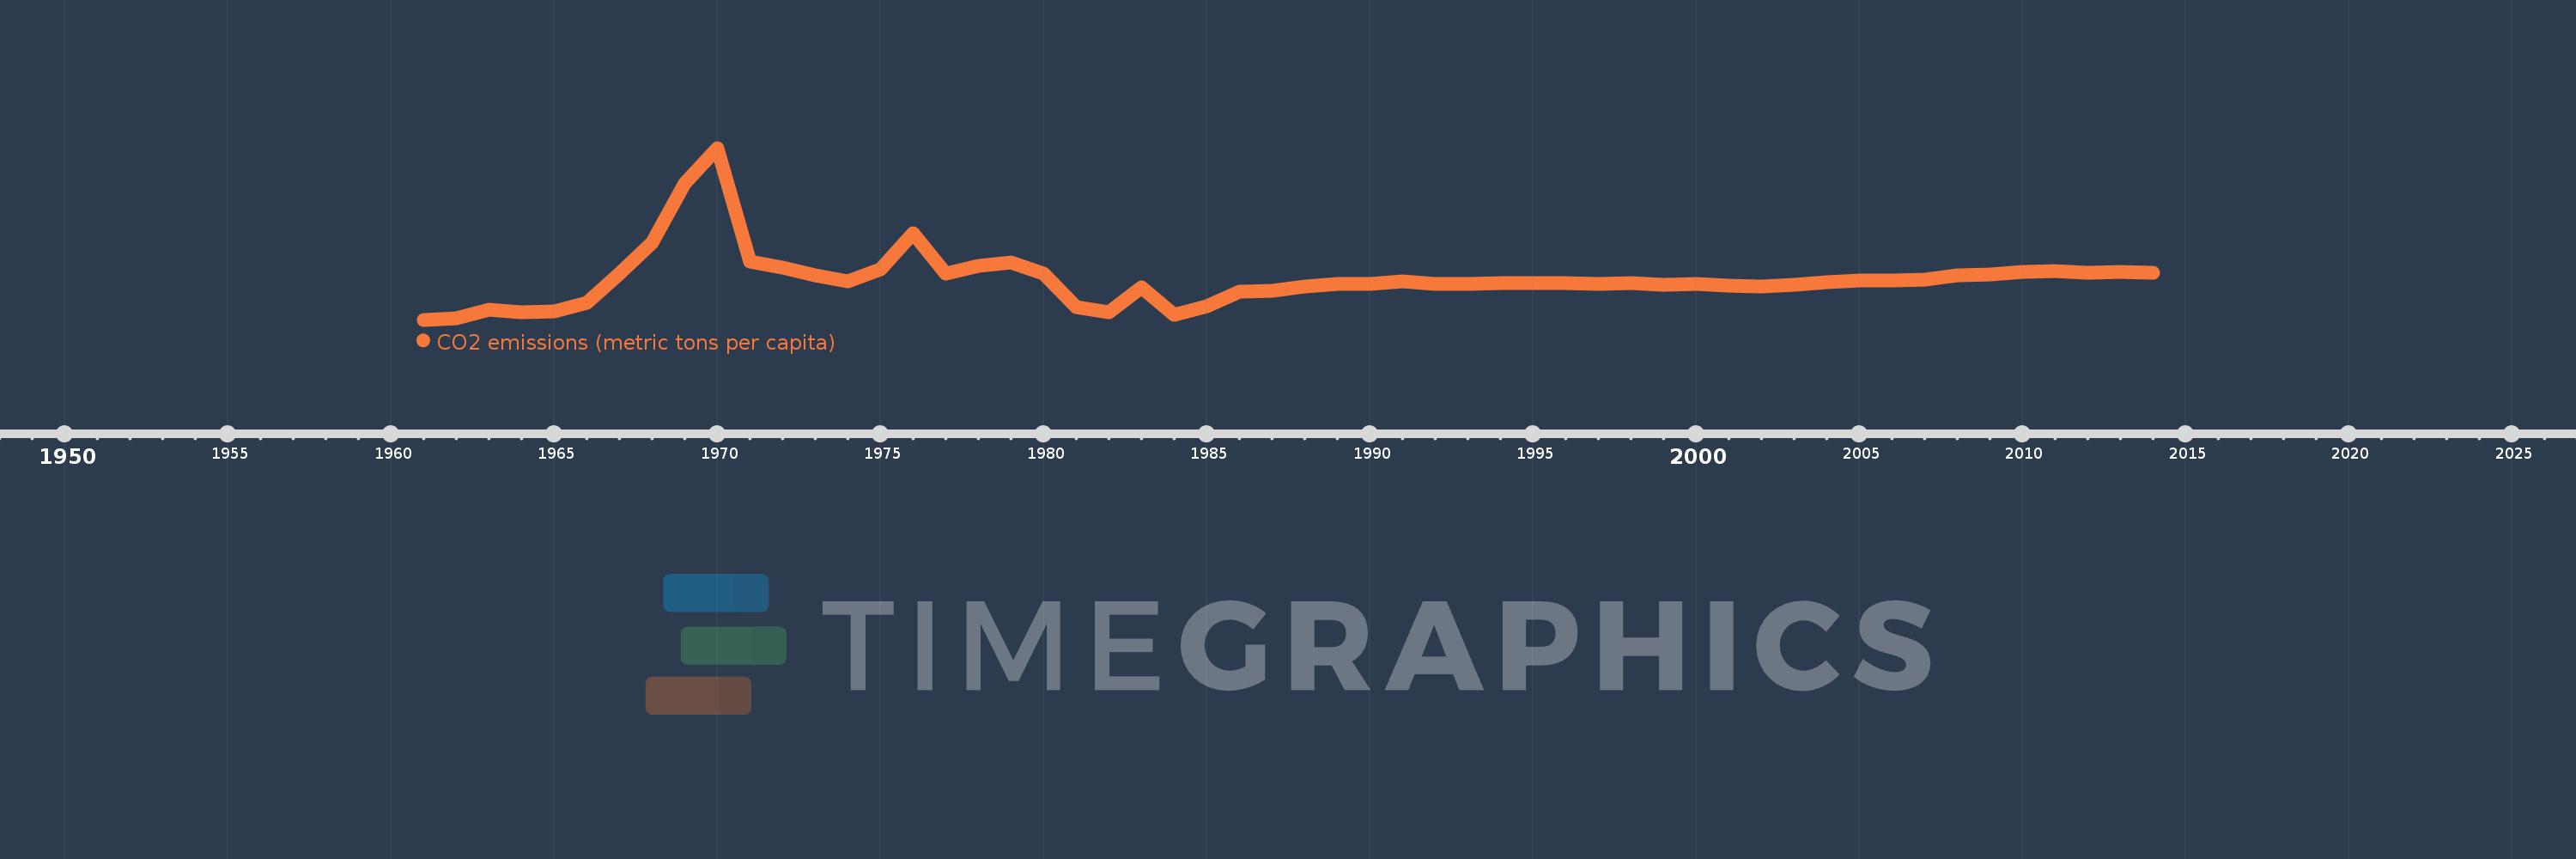
CO2 emissions (metric tons per capita)
2014,2013,2012,2011,2010,2009,2008,2007,2006,2005,2004,2003,2002,2001,2000,1999,1998,1997,1996,1995,1994,1993,1992,1991,1990,1989,1988,1987,1986,1985,1984,1983,1982,1981,1980,1979,1978,1977,1976,1975,1974,1973,1972,1971,1970,1969,1968,1967,1966,1965,1964,1963,1962,1961
This statistics in other country:
AfghanistanAlbaniaAlgeriaAndorraAngolaAntigua and BarbudaArab WorldArgentinaArmeniaArubaAustraliaAustriaAzerbaijanBahamas, TheBahrainBangladeshBarbadosBelarusBelgiumBelizeBeninBermudaBhutanBoliviaBosnia and HerzegovinaBotswanaBrazilBritish Virgin IslandsBrunei DarussalamBulgariaBurkina FasoBurundiCabo VerdeCambodiaCameroonCanadaCaribbean small statesCayman IslandsCentral African RepublicCentral Europe and the BalticsChadChileChinaColombiaComorosCongo, Dem. Rep.Congo, Rep.Costa RicaCote d'IvoireCroatiaCubaCuracaoCyprusCzech RepublicDenmarkDjiboutiDominicaDominican RepublicEarly-demographic dividendEast Asia & PacificEast Asia & Pacific (excluding high income)East Asia & Pacific (IDA & IBRD countries)EcuadorEgypt, Arab Rep.El SalvadorEquatorial GuineaEritreaEstoniaEthiopiaEuro areaEurope & Central AsiaEurope & Central Asia (excluding high income)Europe & Central Asia (IDA & IBRD countries)European UnionFaroe IslandsFijiFinlandFragile and conflict affected situationsFranceFrench PolynesiaGabonGambia, TheGeorgiaGermanyGhanaGibraltarGreeceGreenlandGrenadaGuatemalaGuineaGuinea-BissauGuyanaHaitiHeavily indebted poor countries (HIPC)High incomeHondurasHong Kong SAR, ChinaHungaryIBRD onlyIcelandIDA & IBRD totalIDA blendIDA onlyIDA totalIndiaIndonesiaIran, Islamic Rep.IraqIrelandIsraelItalyJamaicaJapanJordanKazakhstanKenyaKiribatiKorea, Dem. People’s Rep.Korea, Rep.KuwaitKyrgyz RepublicLao PDRLate-demographic dividendLatin America & Caribbean Latin America & Caribbean (excluding high income)Latin America & the Caribbean (IDA & IBRD countries)LatviaLeast developed countries: UN classificationLebanonLesothoLiberiaLibyaLiechtensteinLithuaniaLow & middle incomeLow incomeLower middle incomeLuxembourgMacao SAR, ChinaMacedonia, FYRMadagascarMalawiMalaysiaMaldivesMaliMaltaMarshall IslandsMauritaniaMauritiusMexicoMicronesia, Fed. Sts.Middle East & North AfricaMiddle East & North Africa (excluding high income)Middle East & North Africa (IDA & IBRD countries)Middle incomeMoldovaMongoliaMontenegroMoroccoMozambiqueMyanmarNamibiaNauruNepalNetherlandsNew CaledoniaNew ZealandNicaraguaNigerNigeriaNorth AmericaNorwayOECD membersOmanOther small statesPacific island small statesPakistanPalauPanamaPapua New GuineaParaguayPeruPhilippinesPolandPortugalPost-demographic dividendPre-demographic dividendQatarRomaniaRussian FederationRwandaSamoaSao Tome and PrincipeSaudi ArabiaSenegalSerbiaSeychellesSierra LeoneSingaporeSint Maarten (Dutch part)Slovak RepublicSloveniaSmall statesSolomon IslandsSomaliaSouth AfricaSouth AsiaSouth Asia (IDA & IBRD)South SudanSpainSri LankaSt. Kitts and NevisSt. LuciaSt. Vincent and the GrenadinesSub-Saharan Africa Sub-Saharan Africa (excluding high income)Sub-Saharan Africa (IDA & IBRD countries)SudanSurinameSwazilandSwedenSwitzerlandSyrian Arab RepublicTajikistanTanzaniaThailandTimor-LesteTogoTongaTrinidad and TobagoTunisiaTurkeyTurkmenistanTurks and Caicos IslandsUgandaUkraineUnited Arab EmiratesUnited KingdomUnited StatesUpper middle incomeUruguayUzbekistanVanuatuVenezuela, RBVietnamWest Bank and GazaWorldYemen, Rep.ZambiaZimbabwe Timeline:
This timeline shows a graph from 1961 to 2014 of Antigua and Barbuda. No data until 1960. Number of actual observations by date: 54.
Source name:
World Development Indicators
Source organization:
Carbon Dioxide Information Analysis Center, Environmental Sciences Division, Oak Ridge National Laboratory, Tennessee, United States.
Categories, topics:
Climate Change, Environment
Last updated:
apr 23, 2017
Indicators value changes by year
Maximum:
19.559
jan 1, 1970
At the date of observation
Value
Absolute change
Change from previous value
jan 1, 1961
0.671
+0.671
0.0%
jan 1, 1962
0.86
+0.19
28.31%
jan 1, 1963
1.823
+0.963
111.91%
jan 1, 1964
1.47
-0.353
-19.37%
jan 1, 1965
1.567
+0.097
6.59%
jan 1, 1966
2.52
+0.953
60.83%
jan 1, 1967
5.728
+3.208
127.27%
jan 1, 1968
9.108
+3.38
59.01%
jan 1, 1969
15.672
+6.564
72.07%
jan 1, 1970
19.559
+3.887
24.8%
jan 1, 1971
7.068
-12.491
-63.86%
jan 1, 1972
6.412
-0.656
-9.28%
jan 1, 1973
5.566
-0.847
-13.2%
jan 1, 1974
4.855
-0.71
-12.76%
jan 1, 1975
6.249
+1.394
28.71%
jan 1, 1976
10.219
+3.97
63.53%
jan 1, 1977
5.78
-4.439
-43.44%
jan 1, 1978
6.632
+0.851
14.73%
jan 1, 1979
6.969
+0.337
5.09%
jan 1, 1980
5.769
-1.2
-17.22%
jan 1, 1981
2.034
-3.735
-64.74%
jan 1, 1982
1.525
-0.51
-25.05%
jan 1, 1983
4.255
+2.73
179.06%
jan 1, 1984
1.241
-3.014
-70.83%
jan 1, 1985
2.194
+0.953
76.76%
jan 1, 1986
3.793
+1.599
72.89%
jan 1, 1987
3.86
+0.067
1.76%
jan 1, 1988
4.332
+0.472
12.24%
jan 1, 1989
4.574
+0.241
5.57%
jan 1, 1990
4.616
+0.042
0.92%
jan 1, 1991
4.857
+0.241
5.23%
jan 1, 1992
4.642
-0.216
-4.44%
jan 1, 1993
4.567
-0.075
-1.61%
jan 1, 1994
4.692
+0.125
2.74%
jan 1, 1995
4.684
-0.008
-0.18%
jan 1, 1996
4.721
+0.038
0.8%
jan 1, 1997
4.594
-0.127
-2.7%
jan 1, 1998
4.671
+0.077
1.67%
jan 1, 1999
4.497
-0.174
-3.72%
jan 1, 2000
4.581
+0.084
1.88%
jan 1, 2001
4.439
-0.142
-3.1%
jan 1, 2002
4.365
-0.074
-1.68%
jan 1, 2003
4.536
+0.171
3.93%
jan 1, 2004
4.804
+0.268
5.91%
jan 1, 2005
4.981
+0.177
3.67%
jan 1, 2006
4.974
-0.007
-0.13%
jan 1, 2007
5.096
+0.122
2.45%
jan 1, 2008
5.562
+0.465
9.13%
jan 1, 2009
5.628
+0.067
1.2%
jan 1, 2010
5.906
+0.278
4.94%
jan 1, 2011
6.011
+0.105
1.78%
jan 1, 2012
5.824
-0.187
-3.12%
jan 1, 2013
5.887
+0.064
1.09%
jan 1, 2014
5.827
-0.06
-1.02%
Ranking of countries by current statistics by years


Comments: