29
/
en
AIzaSyAYiBZKx7MnpbEhh9jyipgxe19OcubqV5w
April 1, 2024
23949
Arab World
ARB
false
2
1
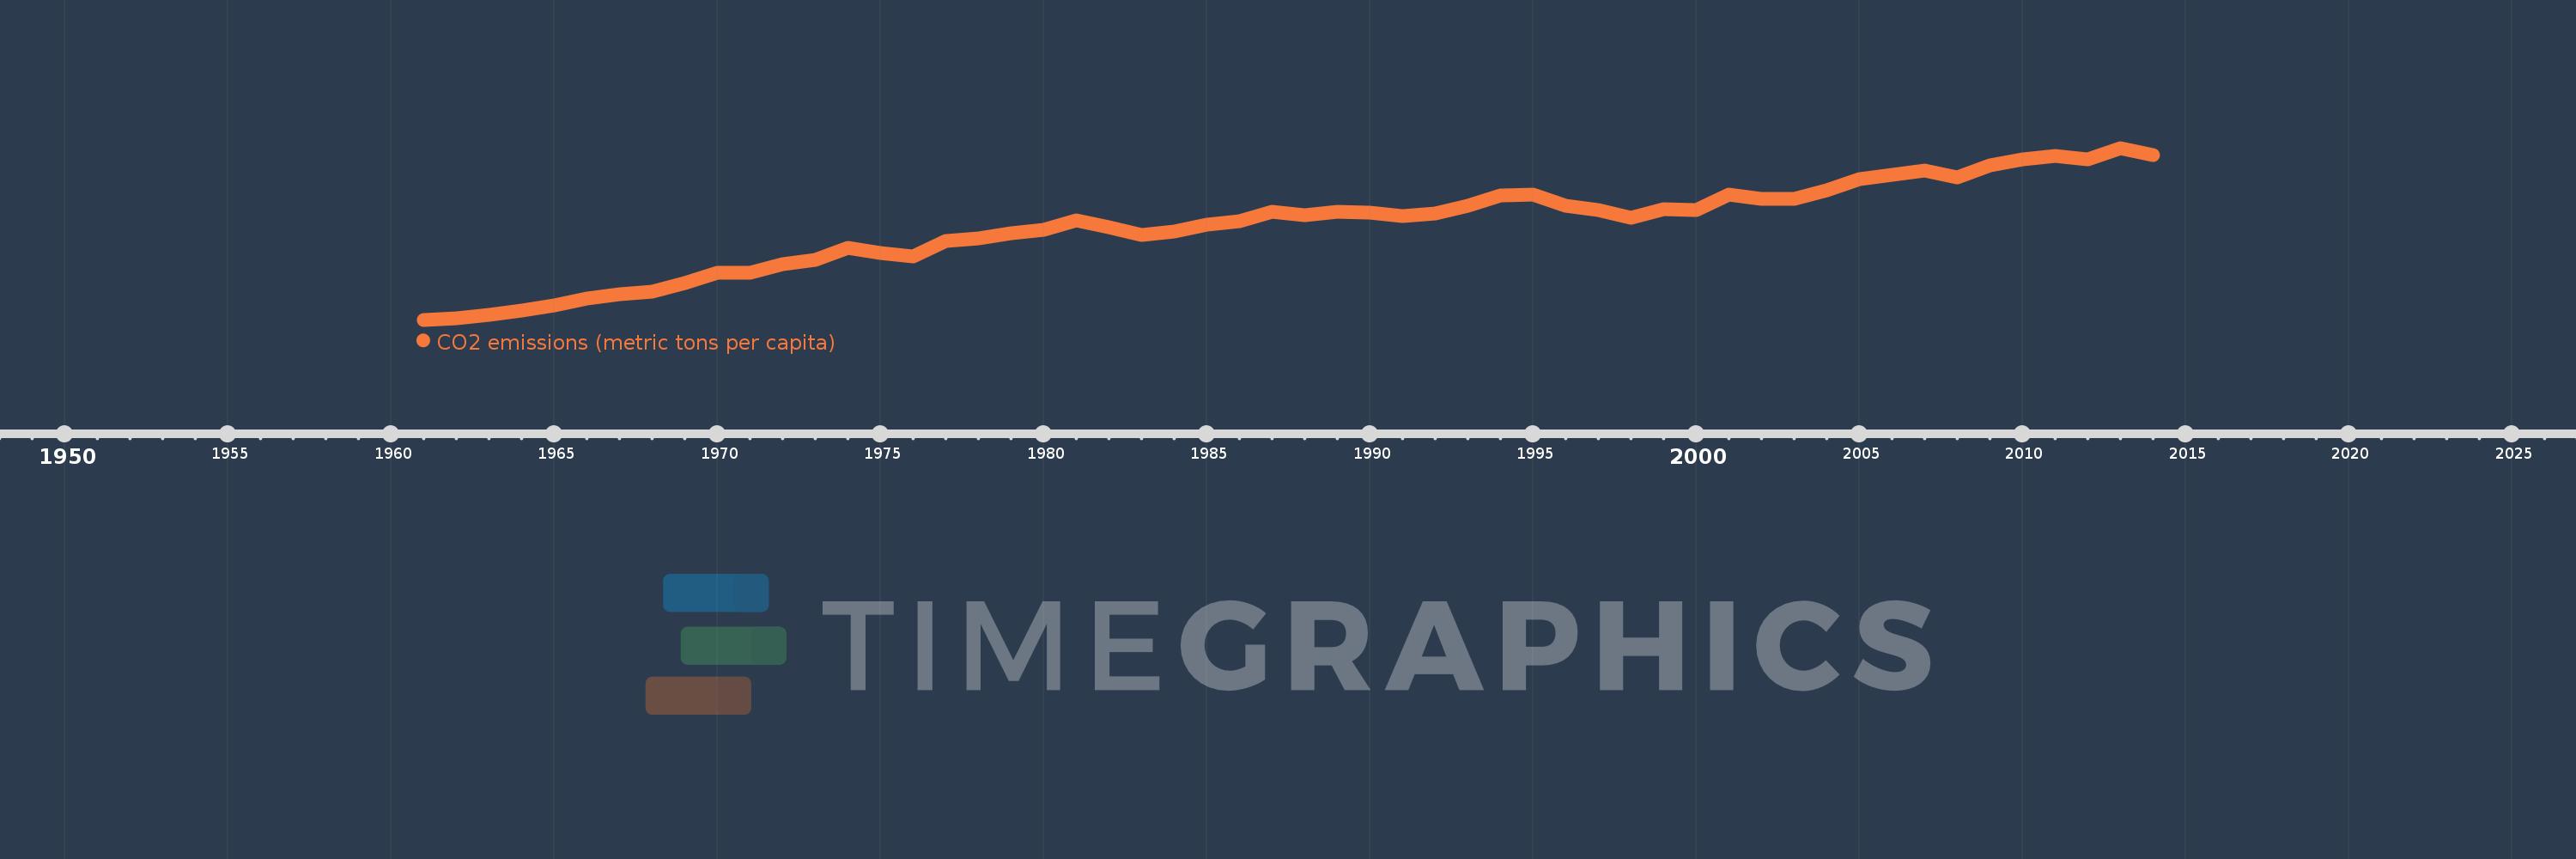
CO2 emissions (metric tons per capita)
2014,2013,2012,2011,2010,2009,2008,2007,2006,2005,2004,2003,2002,2001,2000,1999,1998,1997,1996,1995,1994,1993,1992,1991,1990,1989,1988,1987,1986,1985,1984,1983,1982,1981,1980,1979,1978,1977,1976,1975,1974,1973,1972,1971,1970,1969,1968,1967,1966,1965,1964,1963,1962,1961
This statistics in other country:
AfghanistanAlbaniaAlgeriaAndorraAngolaAntigua and BarbudaArab WorldArgentinaArmeniaArubaAustraliaAustriaAzerbaijanBahamas, TheBahrainBangladeshBarbadosBelarusBelgiumBelizeBeninBermudaBhutanBoliviaBosnia and HerzegovinaBotswanaBrazilBritish Virgin IslandsBrunei DarussalamBulgariaBurkina FasoBurundiCabo VerdeCambodiaCameroonCanadaCaribbean small statesCayman IslandsCentral African RepublicCentral Europe and the BalticsChadChileChinaColombiaComorosCongo, Dem. Rep.Congo, Rep.Costa RicaCote d'IvoireCroatiaCubaCuracaoCyprusCzech RepublicDenmarkDjiboutiDominicaDominican RepublicEarly-demographic dividendEast Asia & PacificEast Asia & Pacific (excluding high income)East Asia & Pacific (IDA & IBRD countries)EcuadorEgypt, Arab Rep.El SalvadorEquatorial GuineaEritreaEstoniaEthiopiaEuro areaEurope & Central AsiaEurope & Central Asia (excluding high income)Europe & Central Asia (IDA & IBRD countries)European UnionFaroe IslandsFijiFinlandFragile and conflict affected situationsFranceFrench PolynesiaGabonGambia, TheGeorgiaGermanyGhanaGibraltarGreeceGreenlandGrenadaGuatemalaGuineaGuinea-BissauGuyanaHaitiHeavily indebted poor countries (HIPC)High incomeHondurasHong Kong SAR, ChinaHungaryIBRD onlyIcelandIDA & IBRD totalIDA blendIDA onlyIDA totalIndiaIndonesiaIran, Islamic Rep.IraqIrelandIsraelItalyJamaicaJapanJordanKazakhstanKenyaKiribatiKorea, Dem. People’s Rep.Korea, Rep.KuwaitKyrgyz RepublicLao PDRLate-demographic dividendLatin America & Caribbean Latin America & Caribbean (excluding high income)Latin America & the Caribbean (IDA & IBRD countries)LatviaLeast developed countries: UN classificationLebanonLesothoLiberiaLibyaLiechtensteinLithuaniaLow & middle incomeLow incomeLower middle incomeLuxembourgMacao SAR, ChinaMacedonia, FYRMadagascarMalawiMalaysiaMaldivesMaliMaltaMarshall IslandsMauritaniaMauritiusMexicoMicronesia, Fed. Sts.Middle East & North AfricaMiddle East & North Africa (excluding high income)Middle East & North Africa (IDA & IBRD countries)Middle incomeMoldovaMongoliaMontenegroMoroccoMozambiqueMyanmarNamibiaNauruNepalNetherlandsNew CaledoniaNew ZealandNicaraguaNigerNigeriaNorth AmericaNorwayOECD membersOmanOther small statesPacific island small statesPakistanPalauPanamaPapua New GuineaParaguayPeruPhilippinesPolandPortugalPost-demographic dividendPre-demographic dividendQatarRomaniaRussian FederationRwandaSamoaSao Tome and PrincipeSaudi ArabiaSenegalSerbiaSeychellesSierra LeoneSingaporeSint Maarten (Dutch part)Slovak RepublicSloveniaSmall statesSolomon IslandsSomaliaSouth AfricaSouth AsiaSouth Asia (IDA & IBRD)South SudanSpainSri LankaSt. Kitts and NevisSt. LuciaSt. Vincent and the GrenadinesSub-Saharan Africa Sub-Saharan Africa (excluding high income)Sub-Saharan Africa (IDA & IBRD countries)SudanSurinameSwazilandSwedenSwitzerlandSyrian Arab RepublicTajikistanTanzaniaThailandTimor-LesteTogoTongaTrinidad and TobagoTunisiaTurkeyTurkmenistanTurks and Caicos IslandsUgandaUkraineUnited Arab EmiratesUnited KingdomUnited StatesUpper middle incomeUruguayUzbekistanVanuatuVenezuela, RBVietnamWest Bank and GazaWorldYemen, Rep.ZambiaZimbabwe Timeline:
This timeline shows a graph from 1961 to 2014 of Arab World. No data until 1960. Number of actual observations by date: 54.
Source name:
World Development Indicators
Source organization:
Carbon Dioxide Information Analysis Center, Environmental Sciences Division, Oak Ridge National Laboratory, Tennessee, United States.
Categories, topics:
Climate Change, Environment
Last updated:
apr 23, 2017
Indicators value changes by year
At the date of observation
Value
Absolute change
Change from previous value
jan 1, 1961
0.644
+0.644
0.0%
jan 1, 1962
0.685
+0.042
6.46%
jan 1, 1963
0.761
+0.076
11.06%
jan 1, 1964
0.875
+0.114
15.0%
jan 1, 1965
0.999
+0.124
14.2%
jan 1, 1966
1.166
+0.167
16.69%
jan 1, 1967
1.273
+0.107
9.2%
jan 1, 1968
1.333
+0.059
4.66%
jan 1, 1969
1.547
+0.215
16.1%
jan 1, 1970
1.794
+0.246
15.92%
jan 1, 1971
1.806
+0.012
0.69%
jan 1, 1972
2.0
+0.194
10.75%
jan 1, 1973
2.119
+0.118
5.91%
jan 1, 1974
2.408
+0.29
13.67%
jan 1, 1975
2.285
-0.123
-5.1%
jan 1, 1976
2.197
-0.089
-3.88%
jan 1, 1977
2.584
+0.387
17.63%
jan 1, 1978
2.648
+0.064
2.46%
jan 1, 1979
2.76
+0.113
4.25%
jan 1, 1980
2.861
+0.101
3.64%
jan 1, 1981
3.09
+0.229
8.0%
jan 1, 1982
2.928
-0.162
-5.24%
jan 1, 1983
2.722
-0.206
-7.04%
jan 1, 1984
2.816
+0.095
3.48%
jan 1, 1985
2.983
+0.167
5.93%
jan 1, 1986
3.065
+0.081
2.73%
jan 1, 1987
3.288
+0.224
7.3%
jan 1, 1988
3.203
-0.085
-2.59%
jan 1, 1989
3.302
+0.099
3.09%
jan 1, 1990
3.266
-0.036
-1.1%
jan 1, 1991
3.182
-0.084
-2.58%
jan 1, 1992
3.259
+0.078
2.44%
jan 1, 1993
3.455
+0.196
6.0%
jan 1, 1994
3.695
+0.24
6.96%
jan 1, 1995
3.711
+0.015
0.42%
jan 1, 1996
3.452
-0.259
-6.97%
jan 1, 1997
3.346
-0.106
-3.08%
jan 1, 1998
3.156
-0.19
-5.67%
jan 1, 1999
3.36
+0.203
6.45%
jan 1, 2000
3.339
-0.02
-0.61%
jan 1, 2001
3.718
+0.378
11.33%
jan 1, 2002
3.623
-0.095
-2.55%
jan 1, 2003
3.623
+0.001
0.02%
jan 1, 2004
3.817
+0.194
5.35%
jan 1, 2005
4.091
+0.274
7.18%
jan 1, 2006
4.206
+0.114
2.8%
jan 1, 2007
4.305
+0.099
2.36%
jan 1, 2008
4.136
-0.169
-3.92%
jan 1, 2009
4.427
+0.291
7.03%
jan 1, 2010
4.589
+0.162
3.65%
jan 1, 2011
4.673
+0.084
1.83%
jan 1, 2012
4.578
-0.094
-2.02%
jan 1, 2013
4.866
+0.288
6.28%
jan 1, 2014
4.7
-0.165
-3.4%
Ranking of countries by current statistics by years


Comments: