29
/
en
AIzaSyAYiBZKx7MnpbEhh9jyipgxe19OcubqV5w
April 1, 2024
157044
Iran, Islamic Rep.
IRN
true
2
1
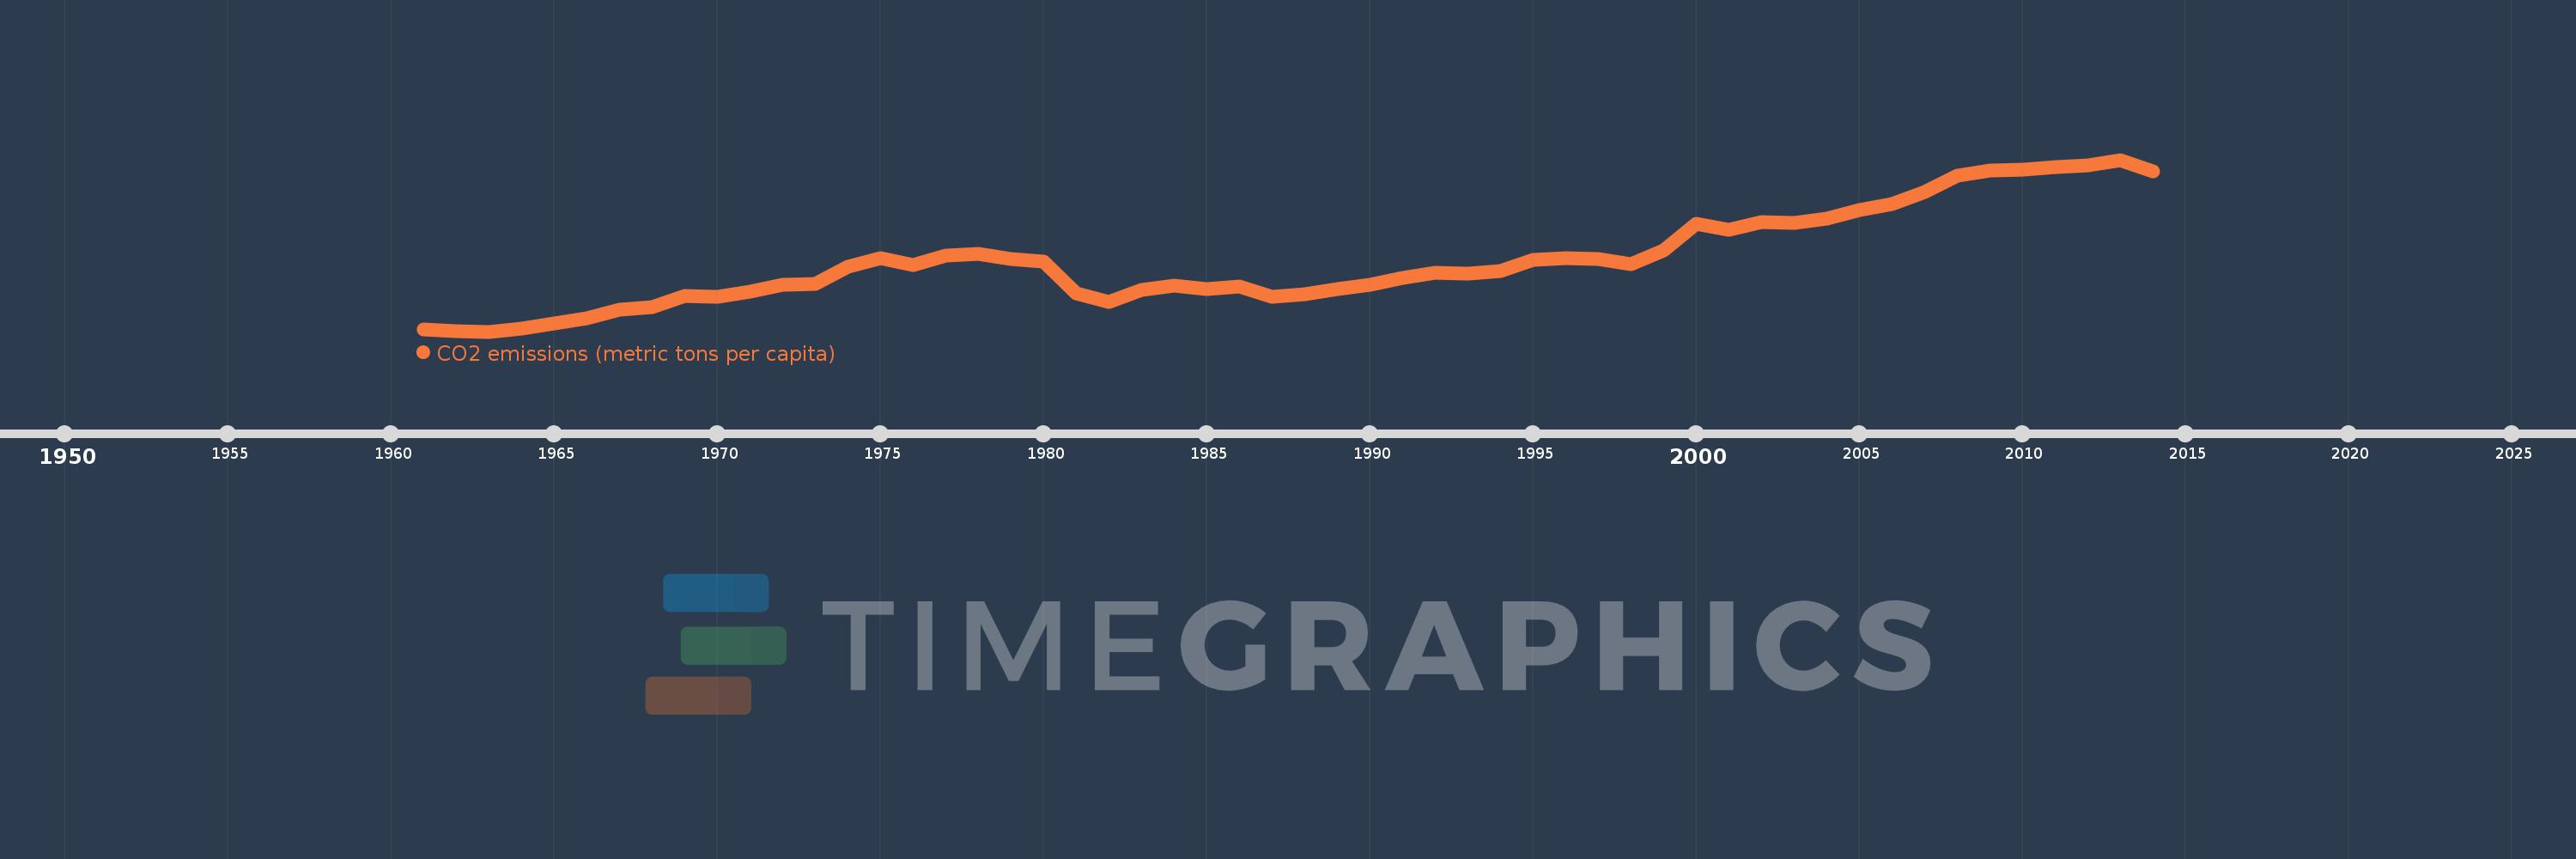
CO2 emissions (metric tons per capita)
2014,2013,2012,2011,2010,2009,2008,2007,2006,2005,2004,2003,2002,2001,2000,1999,1998,1997,1996,1995,1994,1993,1992,1991,1990,1989,1988,1987,1986,1985,1984,1983,1982,1981,1980,1979,1978,1977,1976,1975,1974,1973,1972,1971,1970,1969,1968,1967,1966,1965,1964,1963,1962,1961
This statistics in other country:
AfghanistanAlbaniaAlgeriaAndorraAngolaAntigua and BarbudaArab WorldArgentinaArmeniaArubaAustraliaAustriaAzerbaijanBahamas, TheBahrainBangladeshBarbadosBelarusBelgiumBelizeBeninBermudaBhutanBoliviaBosnia and HerzegovinaBotswanaBrazilBritish Virgin IslandsBrunei DarussalamBulgariaBurkina FasoBurundiCabo VerdeCambodiaCameroonCanadaCaribbean small statesCayman IslandsCentral African RepublicCentral Europe and the BalticsChadChileChinaColombiaComorosCongo, Dem. Rep.Congo, Rep.Costa RicaCote d'IvoireCroatiaCubaCuracaoCyprusCzech RepublicDenmarkDjiboutiDominicaDominican RepublicEarly-demographic dividendEast Asia & PacificEast Asia & Pacific (excluding high income)East Asia & Pacific (IDA & IBRD countries)EcuadorEgypt, Arab Rep.El SalvadorEquatorial GuineaEritreaEstoniaEthiopiaEuro areaEurope & Central AsiaEurope & Central Asia (excluding high income)Europe & Central Asia (IDA & IBRD countries)European UnionFaroe IslandsFijiFinlandFragile and conflict affected situationsFranceFrench PolynesiaGabonGambia, TheGeorgiaGermanyGhanaGibraltarGreeceGreenlandGrenadaGuatemalaGuineaGuinea-BissauGuyanaHaitiHeavily indebted poor countries (HIPC)High incomeHondurasHong Kong SAR, ChinaHungaryIBRD onlyIcelandIDA & IBRD totalIDA blendIDA onlyIDA totalIndiaIndonesiaIran, Islamic Rep.IraqIrelandIsraelItalyJamaicaJapanJordanKazakhstanKenyaKiribatiKorea, Dem. People’s Rep.Korea, Rep.KuwaitKyrgyz RepublicLao PDRLate-demographic dividendLatin America & Caribbean Latin America & Caribbean (excluding high income)Latin America & the Caribbean (IDA & IBRD countries)LatviaLeast developed countries: UN classificationLebanonLesothoLiberiaLibyaLiechtensteinLithuaniaLow & middle incomeLow incomeLower middle incomeLuxembourgMacao SAR, ChinaMacedonia, FYRMadagascarMalawiMalaysiaMaldivesMaliMaltaMarshall IslandsMauritaniaMauritiusMexicoMicronesia, Fed. Sts.Middle East & North AfricaMiddle East & North Africa (excluding high income)Middle East & North Africa (IDA & IBRD countries)Middle incomeMoldovaMongoliaMontenegroMoroccoMozambiqueMyanmarNamibiaNauruNepalNetherlandsNew CaledoniaNew ZealandNicaraguaNigerNigeriaNorth AmericaNorwayOECD membersOmanOther small statesPacific island small statesPakistanPalauPanamaPapua New GuineaParaguayPeruPhilippinesPolandPortugalPost-demographic dividendPre-demographic dividendQatarRomaniaRussian FederationRwandaSamoaSao Tome and PrincipeSaudi ArabiaSenegalSerbiaSeychellesSierra LeoneSingaporeSint Maarten (Dutch part)Slovak RepublicSloveniaSmall statesSolomon IslandsSomaliaSouth AfricaSouth AsiaSouth Asia (IDA & IBRD)South SudanSpainSri LankaSt. Kitts and NevisSt. LuciaSt. Vincent and the GrenadinesSub-Saharan Africa Sub-Saharan Africa (excluding high income)Sub-Saharan Africa (IDA & IBRD countries)SudanSurinameSwazilandSwedenSwitzerlandSyrian Arab RepublicTajikistanTanzaniaThailandTimor-LesteTogoTongaTrinidad and TobagoTunisiaTurkeyTurkmenistanTurks and Caicos IslandsUgandaUkraineUnited Arab EmiratesUnited KingdomUnited StatesUpper middle incomeUruguayUzbekistanVanuatuVenezuela, RBVietnamWest Bank and GazaWorldYemen, Rep.ZambiaZimbabwe Timeline:
This timeline shows a graph from 1961 to 2014 of Iran, Islamic Rep.. No data until 1960. Number of actual observations by date: 54.
Source name:
World Development Indicators
Source organization:
Carbon Dioxide Information Analysis Center, Environmental Sciences Division, Oak Ridge National Laboratory, Tennessee, United States.
Categories, topics:
Climate Change, Environment
Last updated:
apr 23, 2017
Indicators value changes by year
At the date of observation
Value
Absolute change
Change from previous value
jan 1, 1961
1.707
+1.707
0.0%
jan 1, 1962
1.625
-0.081
-4.77%
jan 1, 1963
1.624
-0.002
-0.11%
jan 1, 1964
1.746
+0.122
7.52%
jan 1, 1965
1.957
+0.211
12.07%
jan 1, 1966
2.154
+0.198
10.11%
jan 1, 1967
2.504
+0.349
16.22%
jan 1, 1968
2.582
+0.078
3.1%
jan 1, 1969
3.048
+0.467
18.08%
jan 1, 1970
2.994
-0.055
-1.8%
jan 1, 1971
3.222
+0.228
7.63%
jan 1, 1972
3.474
+0.252
7.82%
jan 1, 1973
3.529
+0.055
1.57%
jan 1, 1974
4.194
+0.665
18.85%
jan 1, 1975
4.528
+0.334
7.97%
jan 1, 1976
4.257
-0.27
-5.97%
jan 1, 1977
4.643
+0.385
9.05%
jan 1, 1978
4.71
+0.067
1.45%
jan 1, 1979
4.516
-0.194
-4.12%
jan 1, 1980
4.403
-0.113
-2.51%
jan 1, 1981
3.127
-1.276
-28.98%
jan 1, 1982
2.808
-0.319
-10.2%
jan 1, 1983
3.297
+0.489
17.41%
jan 1, 1984
3.435
+0.138
4.18%
jan 1, 1985
3.316
-0.118
-3.44%
jan 1, 1986
3.4
+0.083
2.51%
jan 1, 1987
3.016
-0.384
-11.29%
jan 1, 1988
3.12
+0.104
3.44%
jan 1, 1989
3.321
+0.201
6.45%
jan 1, 1990
3.493
+0.173
5.2%
jan 1, 1991
3.757
+0.263
7.54%
jan 1, 1992
3.978
+0.221
5.88%
jan 1, 1993
3.938
-0.039
-0.99%
jan 1, 1994
4.039
+0.101
2.56%
jan 1, 1995
4.464
+0.425
10.53%
jan 1, 1996
4.532
+0.068
1.51%
jan 1, 1997
4.51
-0.021
-0.47%
jan 1, 1998
4.321
-0.189
-4.19%
jan 1, 1999
4.857
+0.536
12.4%
jan 1, 2000
5.905
+1.048
21.57%
jan 1, 2001
5.656
-0.248
-4.2%
jan 1, 2002
5.967
+0.31
5.49%
jan 1, 2003
5.938
-0.029
-0.48%
jan 1, 2004
6.11
+0.171
2.89%
jan 1, 2005
6.452
+0.342
5.6%
jan 1, 2006
6.688
+0.236
3.67%
jan 1, 2007
7.185
+0.497
7.42%
jan 1, 2008
7.821
+0.636
8.85%
jan 1, 2009
8.023
+0.203
2.59%
jan 1, 2010
8.061
+0.037
0.47%
jan 1, 2011
8.151
+0.09
1.11%
jan 1, 2012
8.235
+0.085
1.04%
jan 1, 2013
8.454
+0.219
2.66%
jan 1, 2014
7.997
-0.458
-5.41%
Ranking of countries by current statistics by years


Comments: