29
/
en
AIzaSyAYiBZKx7MnpbEhh9jyipgxe19OcubqV5w
April 1, 2024
91428
Brazil
BRA
true
2
1
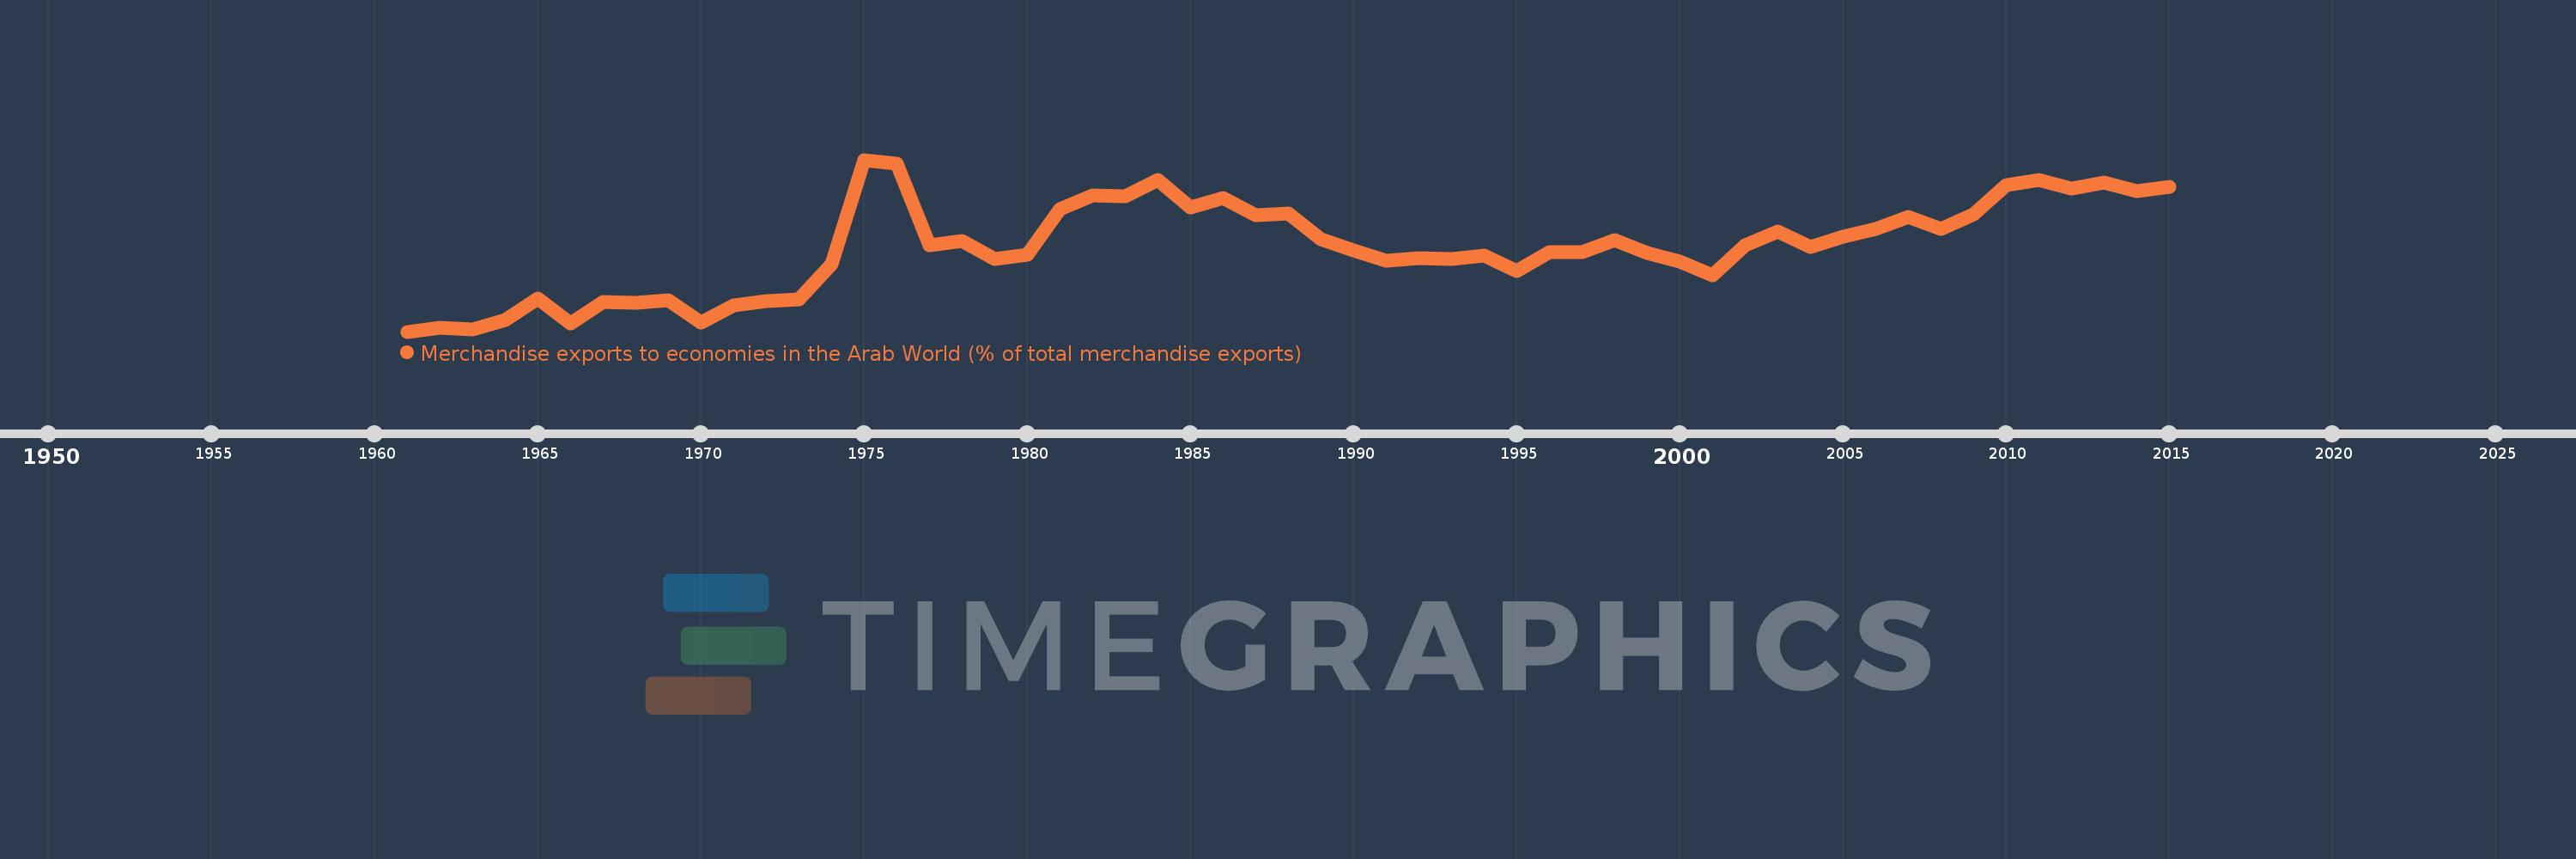
Merchandise exports to economies in the Arab World (% of total merchandise exports)
2015,2014,2013,2012,2011,2010,2009,2008,2007,2006,2005,2004,2003,2002,2001,2000,1999,1998,1997,1996,1995,1994,1993,1992,1991,1990,1989,1988,1987,1986,1985,1984,1983,1982,1981,1980,1979,1978,1977,1976,1975,1974,1973,1972,1971,1970,1969,1968,1967,1966,1965,1964,1963,1962,1961
This statistics in other country:
AfghanistanAlbaniaAlgeriaAngolaArab WorldArgentinaArmeniaArubaAustraliaAustriaAzerbaijanBahamas, TheBahrainBangladeshBarbadosBelarusBelgiumBelizeBeninBermudaBoliviaBosnia and HerzegovinaBrazilBrunei DarussalamBulgariaBurkina FasoBurundiCabo VerdeCambodiaCameroonCanadaCaribbean small statesCentral African RepublicCentral Europe and the BalticsChadChileChinaColombiaComorosCongo, Dem. Rep.Congo, Rep.Costa RicaCote d'IvoireCroatiaCubaCyprusCzech RepublicDenmarkDjiboutiDominicaDominican RepublicEarly-demographic dividendEast Asia & PacificEast Asia & Pacific (excluding high income)East Asia & Pacific (IDA & IBRD countries)EcuadorEgypt, Arab Rep.El SalvadorEstoniaEthiopiaEuro areaEurope & Central AsiaEurope & Central Asia (excluding high income)Europe & Central Asia (IDA & IBRD countries)European UnionFijiFinlandFragile and conflict affected situationsFranceGabonGambia, TheGeorgiaGermanyGhanaGreeceGreenlandGrenadaGuatemalaGuineaGuinea-BissauGuyanaHaitiHeavily indebted poor countries (HIPC)High incomeHondurasHong Kong SAR, ChinaHungaryIBRD onlyIcelandIDA & IBRD totalIDA blendIDA onlyIDA totalIndiaIndonesiaIran, Islamic Rep.IraqIrelandIsraelItalyJamaicaJapanJordanKazakhstanKenyaKorea, Dem. People’s Rep.Korea, Rep.KosovoKuwaitKyrgyz RepublicLao PDRLate-demographic dividendLatin America & Caribbean Latin America & Caribbean (excluding high income)Latin America & the Caribbean (IDA & IBRD countries)LatviaLeast developed countries: UN classificationLebanonLiberiaLibyaLithuaniaLow & middle incomeLow incomeLower middle incomeLuxembourgMacao SAR, ChinaMacedonia, FYRMadagascarMalawiMalaysiaMaldivesMaliMaltaMauritaniaMauritiusMexicoMiddle East & North AfricaMiddle East & North Africa (excluding high income)Middle East & North Africa (IDA & IBRD countries)Middle incomeMoldovaMongoliaMontenegroMoroccoMozambiqueMyanmarNepalNetherlandsNew CaledoniaNew ZealandNicaraguaNigerNigeriaNorth AmericaNorwayOECD membersOmanOther small statesPacific island small statesPakistanPanamaPapua New GuineaParaguayPeruPhilippinesPolandPortugalPost-demographic dividendPre-demographic dividendQatarRomaniaRussian FederationRwandaSamoaSaudi ArabiaSenegalSerbiaSeychellesSierra LeoneSingaporeSlovak RepublicSloveniaSmall statesSomaliaSouth AfricaSouth AsiaSouth Asia (IDA & IBRD)SpainSri LankaSt. LuciaSt. Vincent and the GrenadinesSub-Saharan Africa Sub-Saharan Africa (excluding high income)Sub-Saharan Africa (IDA & IBRD countries)SudanSurinameSwedenSwitzerlandSyrian Arab RepublicTajikistanTanzaniaThailandTogoTrinidad and TobagoTunisiaTurkeyTurkmenistanUgandaUkraineUnited Arab EmiratesUnited KingdomUnited StatesUpper middle incomeUruguayUzbekistanVenezuela, RBVietnamWorldYemen, Rep.ZambiaZimbabwe Timeline:
This timeline shows a graph from 1961 to 2015 of Brazil. No data until 1960. Number of actual observations by date: 55.
Source name:
World Development Indicators
Source organization:
World Bank staff estimates based data from International Monetary Fund's Direction of Trade database.
Categories, topics:
Private Sector, Trade
Last updated:
apr 23, 2017
Indicators value changes by year
At the date of observation
Value
Absolute change
Change from previous value
jan 1, 1961
0.614
+0.614
0.0%
jan 1, 1962
0.763
+0.149
24.21%
jan 1, 1963
0.709
-0.054
-7.11%
jan 1, 1964
1.045
+0.336
47.43%
jan 1, 1965
1.824
+0.779
74.57%
jan 1, 1966
0.928
-0.896
-49.14%
jan 1, 1967
1.717
+0.79
85.12%
jan 1, 1968
1.692
-0.025
-1.46%
jan 1, 1969
1.775
+0.083
4.89%
jan 1, 1970
0.963
-0.812
-45.73%
jan 1, 1971
1.58
+0.617
64.01%
jan 1, 1972
1.743
+0.163
10.3%
jan 1, 1973
1.813
+0.07
4.02%
jan 1, 1974
3.11
+1.297
71.56%
jan 1, 1975
6.968
+3.857
124.01%
jan 1, 1976
6.815
-0.153
-2.2%
jan 1, 1977
3.797
-3.018
-44.29%
jan 1, 1978
3.975
+0.178
4.69%
jan 1, 1979
3.286
-0.689
-17.33%
jan 1, 1980
3.461
+0.175
5.32%
jan 1, 1981
5.133
+1.672
48.32%
jan 1, 1982
5.647
+0.513
10.0%
jan 1, 1983
5.612
-0.035
-0.62%
jan 1, 1984
6.214
+0.602
10.74%
jan 1, 1985
5.22
-0.994
-16.0%
jan 1, 1986
5.546
+0.326
6.25%
jan 1, 1987
4.915
-0.632
-11.39%
jan 1, 1988
4.967
+0.053
1.08%
jan 1, 1989
4.023
-0.945
-19.02%
jan 1, 1990
3.632
-0.39
-9.71%
jan 1, 1991
3.232
-0.4
-11.01%
jan 1, 1992
3.319
+0.087
2.68%
jan 1, 1993
3.308
-0.011
-0.32%
jan 1, 1994
3.425
+0.117
3.52%
jan 1, 1995
2.863
-0.562
-16.42%
jan 1, 1996
3.547
+0.684
23.89%
jan 1, 1997
3.554
+0.008
0.22%
jan 1, 1998
3.996
+0.441
12.42%
jan 1, 1999
3.519
-0.477
-11.93%
jan 1, 2000
3.198
-0.321
-9.12%
jan 1, 2001
2.698
-0.5
-15.63%
jan 1, 2002
3.802
+1.104
40.91%
jan 1, 2003
4.316
+0.514
13.51%
jan 1, 2004
3.746
-0.57
-13.21%
jan 1, 2005
4.131
+0.385
10.28%
jan 1, 2006
4.395
+0.265
6.4%
jan 1, 2007
4.855
+0.459
10.45%
jan 1, 2008
4.415
-0.44
-9.07%
jan 1, 2009
4.96
+0.546
12.36%
jan 1, 2010
6.037
+1.077
21.72%
jan 1, 2011
6.228
+0.19
3.16%
jan 1, 2012
5.904
-0.324
-5.2%
jan 1, 2013
6.117
+0.213
3.61%
jan 1, 2014
5.802
-0.315
-5.15%
jan 1, 2015
5.955
+0.154
2.65%
Ranking of countries by current statistics by years


Comments: