29
/
en
AIzaSyAYiBZKx7MnpbEhh9jyipgxe19OcubqV5w
April 1, 2024
204335
Myanmar
MMR
true
2
1
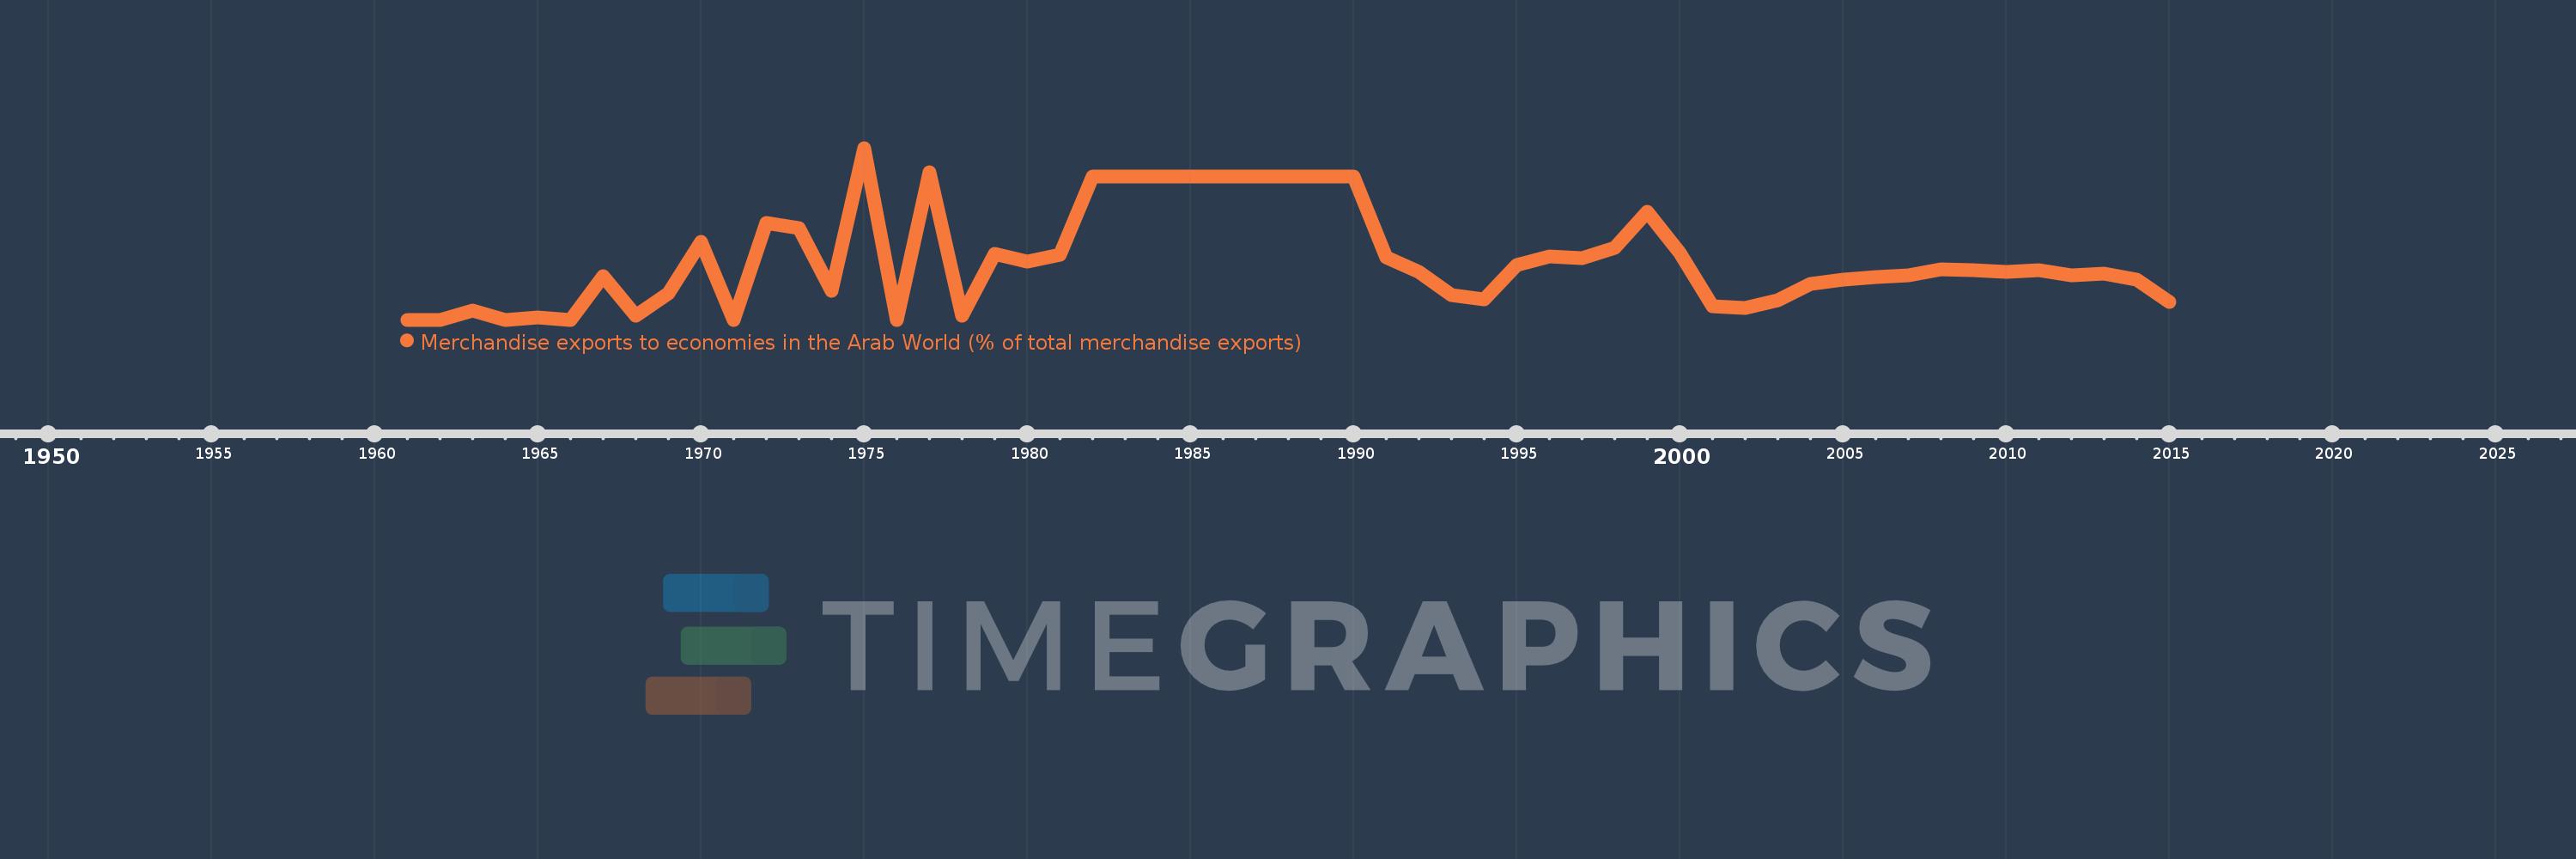
Merchandise exports to economies in the Arab World (% of total merchandise exports)
2015,2014,2013,2012,2011,2010,2009,2008,2007,2006,2005,2004,2003,2002,2001,2000,1999,1998,1997,1996,1995,1994,1993,1992,1991,1990,1989,1988,1987,1986,1985,1984,1983,1982,1981,1980,1979,1978,1977,1976,1975,1974,1973,1972,1971,1970,1969,1968,1967,1966,1965,1964,1963,1962,1961
This statistics in other country:
AfghanistanAlbaniaAlgeriaAngolaArab WorldArgentinaArmeniaArubaAustraliaAustriaAzerbaijanBahamas, TheBahrainBangladeshBarbadosBelarusBelgiumBelizeBeninBermudaBoliviaBosnia and HerzegovinaBrazilBrunei DarussalamBulgariaBurkina FasoBurundiCabo VerdeCambodiaCameroonCanadaCaribbean small statesCentral African RepublicCentral Europe and the BalticsChadChileChinaColombiaComorosCongo, Dem. Rep.Congo, Rep.Costa RicaCote d'IvoireCroatiaCubaCyprusCzech RepublicDenmarkDjiboutiDominicaDominican RepublicEarly-demographic dividendEast Asia & PacificEast Asia & Pacific (excluding high income)East Asia & Pacific (IDA & IBRD countries)EcuadorEgypt, Arab Rep.El SalvadorEstoniaEthiopiaEuro areaEurope & Central AsiaEurope & Central Asia (excluding high income)Europe & Central Asia (IDA & IBRD countries)European UnionFijiFinlandFragile and conflict affected situationsFranceGabonGambia, TheGeorgiaGermanyGhanaGreeceGreenlandGrenadaGuatemalaGuineaGuinea-BissauGuyanaHaitiHeavily indebted poor countries (HIPC)High incomeHondurasHong Kong SAR, ChinaHungaryIBRD onlyIcelandIDA & IBRD totalIDA blendIDA onlyIDA totalIndiaIndonesiaIran, Islamic Rep.IraqIrelandIsraelItalyJamaicaJapanJordanKazakhstanKenyaKorea, Dem. People’s Rep.Korea, Rep.KosovoKuwaitKyrgyz RepublicLao PDRLate-demographic dividendLatin America & Caribbean Latin America & Caribbean (excluding high income)Latin America & the Caribbean (IDA & IBRD countries)LatviaLeast developed countries: UN classificationLebanonLiberiaLibyaLithuaniaLow & middle incomeLow incomeLower middle incomeLuxembourgMacao SAR, ChinaMacedonia, FYRMadagascarMalawiMalaysiaMaldivesMaliMaltaMauritaniaMauritiusMexicoMiddle East & North AfricaMiddle East & North Africa (excluding high income)Middle East & North Africa (IDA & IBRD countries)Middle incomeMoldovaMongoliaMontenegroMoroccoMozambiqueMyanmarNepalNetherlandsNew CaledoniaNew ZealandNicaraguaNigerNigeriaNorth AmericaNorwayOECD membersOmanOther small statesPacific island small statesPakistanPanamaPapua New GuineaParaguayPeruPhilippinesPolandPortugalPost-demographic dividendPre-demographic dividendQatarRomaniaRussian FederationRwandaSamoaSaudi ArabiaSenegalSerbiaSeychellesSierra LeoneSingaporeSlovak RepublicSloveniaSmall statesSomaliaSouth AfricaSouth AsiaSouth Asia (IDA & IBRD)SpainSri LankaSt. LuciaSt. Vincent and the GrenadinesSub-Saharan Africa Sub-Saharan Africa (excluding high income)Sub-Saharan Africa (IDA & IBRD countries)SudanSurinameSwedenSwitzerlandSyrian Arab RepublicTajikistanTanzaniaThailandTogoTrinidad and TobagoTunisiaTurkeyTurkmenistanUgandaUkraineUnited Arab EmiratesUnited KingdomUnited StatesUpper middle incomeUruguayUzbekistanVenezuela, RBVietnamWorldYemen, Rep.ZambiaZimbabwe Timeline:
This timeline shows a graph from 1961 to 2015 of Myanmar. No data until 1960. Number of actual observations by date: 55.
Source name:
World Development Indicators
Source organization:
World Bank staff estimates based data from International Monetary Fund's Direction of Trade database.
Categories, topics:
Private Sector, Trade
Last updated:
apr 23, 2017
Indicators value changes by year
At the date of observation
Value
Absolute change
Change from previous value
jan 1, 1963
0.159
+0.159
%
jan 1, 1964
0.0
-0.159
-100.0%
jan 1, 1965
0.045
+0.045
%
jan 1, 1966
0.0
-0.045
-100.0%
jan 1, 1967
0.758
+0.758
%
jan 1, 1968
0.078
-0.679
-89.66%
jan 1, 1969
0.456
+0.378
482.57%
jan 1, 1970
1.357
+0.901
197.41%
jan 1, 1971
0.0
-1.357
-100.0%
jan 1, 1972
1.692
+1.692
%
jan 1, 1973
1.596
-0.095
-5.64%
jan 1, 1974
0.501
-1.095
-68.6%
jan 1, 1975
3.005
+2.504
499.52%
jan 1, 1976
0.0
-3.005
-100.0%
jan 1, 1977
2.573
+2.573
%
jan 1, 1978
0.074
-2.499
-97.12%
jan 1, 1979
1.158
+1.084
1.46K%
jan 1, 1980
1.023
-0.135
-11.64%
jan 1, 1981
1.141
+0.118
11.56%
jan 1, 1982
2.51
+1.369
119.93%
jan 1, 1983
2.51
+0.0
0.0%
jan 1, 1985
2.51
+0.0
0.0%
jan 1, 1990
2.51
+0.0
0.0%
jan 1, 1991
1.094
-1.416
-56.42%
jan 1, 1992
0.836
-0.258
-23.55%
jan 1, 1993
0.432
-0.404
-48.37%
jan 1, 1994
0.363
-0.069
-15.88%
jan 1, 1995
0.959
+0.595
163.95%
jan 1, 1996
1.108
+0.149
15.58%
jan 1, 1997
1.072
-0.036
-3.27%
jan 1, 1998
1.258
+0.187
17.41%
jan 1, 1999
1.893
+0.635
50.47%
jan 1, 2000
1.17
-0.723
-38.21%
jan 1, 2001
0.239
-0.931
-79.6%
jan 1, 2002
0.212
-0.027
-11.19%
jan 1, 2003
0.347
+0.135
63.57%
jan 1, 2004
0.621
+0.275
79.22%
jan 1, 2005
0.701
+0.079
12.74%
jan 1, 2006
0.743
+0.043
6.09%
jan 1, 2007
0.775
+0.031
4.23%
jan 1, 2008
0.877
+0.102
13.2%
jan 1, 2009
0.866
-0.011
-1.2%
jan 1, 2010
0.839
-0.027
-3.16%
jan 1, 2011
0.869
+0.03
3.61%
jan 1, 2012
0.776
-0.093
-10.67%
jan 1, 2013
0.814
+0.037
4.83%
jan 1, 2014
0.707
-0.107
-13.12%
jan 1, 2015
0.317
-0.39
-55.19%
Ranking of countries by current statistics by years


Comments: