29
/
en
AIzaSyAYiBZKx7MnpbEhh9jyipgxe19OcubqV5w
April 1, 2024
52041
North America
NAC
false
2
1
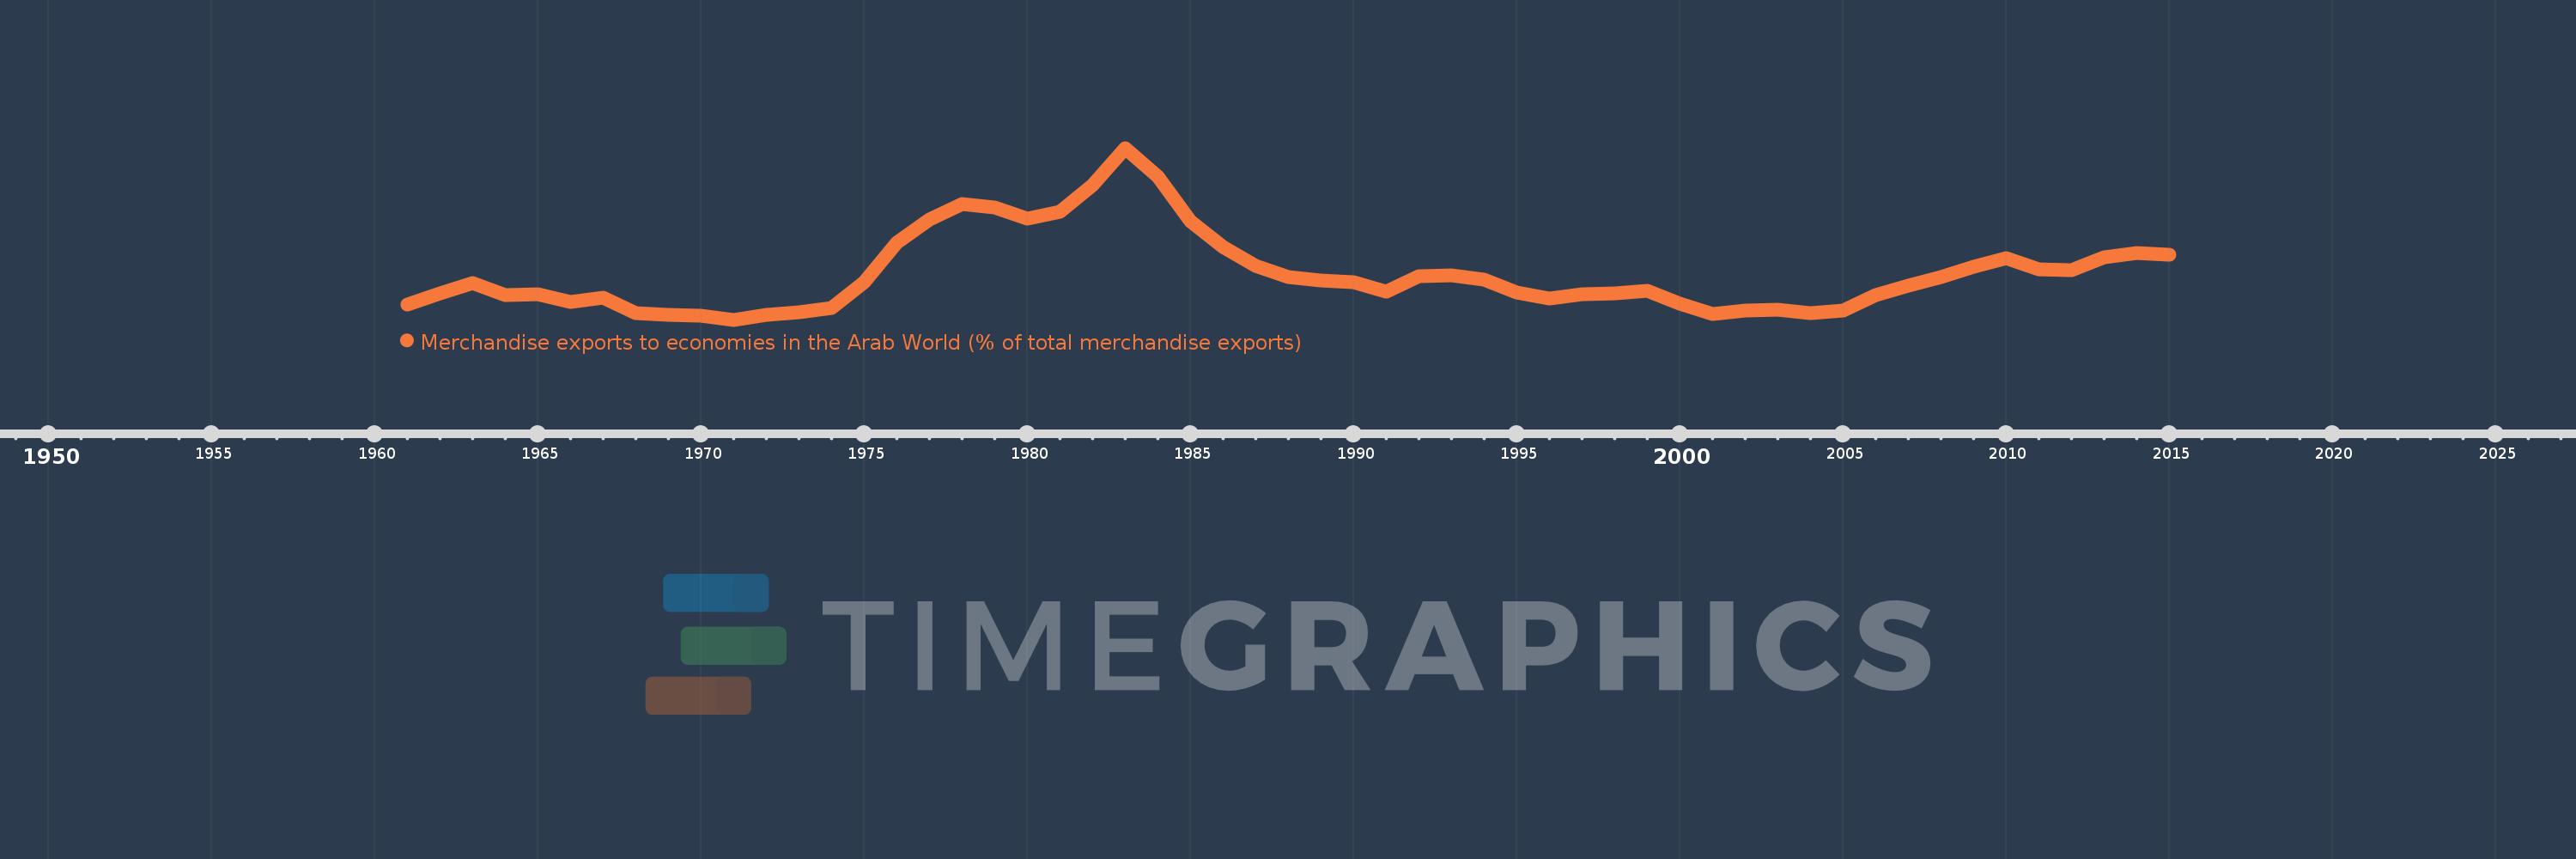
Merchandise exports to economies in the Arab World (% of total merchandise exports)
2015,2014,2013,2012,2011,2010,2009,2008,2007,2006,2005,2004,2003,2002,2001,2000,1999,1998,1997,1996,1995,1994,1993,1992,1991,1990,1989,1988,1987,1986,1985,1984,1983,1982,1981,1980,1979,1978,1977,1976,1975,1974,1973,1972,1971,1970,1969,1968,1967,1966,1965,1964,1963,1962,1961
This statistics in other country:
AfghanistanAlbaniaAlgeriaAngolaArab WorldArgentinaArmeniaArubaAustraliaAustriaAzerbaijanBahamas, TheBahrainBangladeshBarbadosBelarusBelgiumBelizeBeninBermudaBoliviaBosnia and HerzegovinaBrazilBrunei DarussalamBulgariaBurkina FasoBurundiCabo VerdeCambodiaCameroonCanadaCaribbean small statesCentral African RepublicCentral Europe and the BalticsChadChileChinaColombiaComorosCongo, Dem. Rep.Congo, Rep.Costa RicaCote d'IvoireCroatiaCubaCyprusCzech RepublicDenmarkDjiboutiDominicaDominican RepublicEarly-demographic dividendEast Asia & PacificEast Asia & Pacific (excluding high income)East Asia & Pacific (IDA & IBRD countries)EcuadorEgypt, Arab Rep.El SalvadorEstoniaEthiopiaEuro areaEurope & Central AsiaEurope & Central Asia (excluding high income)Europe & Central Asia (IDA & IBRD countries)European UnionFijiFinlandFragile and conflict affected situationsFranceGabonGambia, TheGeorgiaGermanyGhanaGreeceGreenlandGrenadaGuatemalaGuineaGuinea-BissauGuyanaHaitiHeavily indebted poor countries (HIPC)High incomeHondurasHong Kong SAR, ChinaHungaryIBRD onlyIcelandIDA & IBRD totalIDA blendIDA onlyIDA totalIndiaIndonesiaIran, Islamic Rep.IraqIrelandIsraelItalyJamaicaJapanJordanKazakhstanKenyaKorea, Dem. People’s Rep.Korea, Rep.KosovoKuwaitKyrgyz RepublicLao PDRLate-demographic dividendLatin America & Caribbean Latin America & Caribbean (excluding high income)Latin America & the Caribbean (IDA & IBRD countries)LatviaLeast developed countries: UN classificationLebanonLiberiaLibyaLithuaniaLow & middle incomeLow incomeLower middle incomeLuxembourgMacao SAR, ChinaMacedonia, FYRMadagascarMalawiMalaysiaMaldivesMaliMaltaMauritaniaMauritiusMexicoMiddle East & North AfricaMiddle East & North Africa (excluding high income)Middle East & North Africa (IDA & IBRD countries)Middle incomeMoldovaMongoliaMontenegroMoroccoMozambiqueMyanmarNepalNetherlandsNew CaledoniaNew ZealandNicaraguaNigerNigeriaNorth AmericaNorwayOECD membersOmanOther small statesPacific island small statesPakistanPanamaPapua New GuineaParaguayPeruPhilippinesPolandPortugalPost-demographic dividendPre-demographic dividendQatarRomaniaRussian FederationRwandaSamoaSaudi ArabiaSenegalSerbiaSeychellesSierra LeoneSingaporeSlovak RepublicSloveniaSmall statesSomaliaSouth AfricaSouth AsiaSouth Asia (IDA & IBRD)SpainSri LankaSt. LuciaSt. Vincent and the GrenadinesSub-Saharan Africa Sub-Saharan Africa (excluding high income)Sub-Saharan Africa (IDA & IBRD countries)SudanSurinameSwedenSwitzerlandSyrian Arab RepublicTajikistanTanzaniaThailandTogoTrinidad and TobagoTunisiaTurkeyTurkmenistanUgandaUkraineUnited Arab EmiratesUnited KingdomUnited StatesUpper middle incomeUruguayUzbekistanVenezuela, RBVietnamWorldYemen, Rep.ZambiaZimbabwe Timeline:
This timeline shows a graph from 1961 to 2015 of North America. No data until 1960. Number of actual observations by date: 55.
Source name:
World Development Indicators
Source organization:
World Bank staff estimates based data from International Monetary Fund's Direction of Trade database.
Categories, topics:
Private Sector, Trade
Last updated:
apr 23, 2017
Indicators value changes by year
At the date of observation
Value
Absolute change
Change from previous value
jan 1, 1961
2.056
+2.056
0.0%
jan 1, 1962
2.403
+0.347
16.87%
jan 1, 1963
2.745
+0.341
14.21%
jan 1, 1964
2.342
-0.403
-14.68%
jan 1, 1965
2.381
+0.04
1.69%
jan 1, 1966
2.128
-0.253
-10.63%
jan 1, 1967
2.268
+0.139
6.55%
jan 1, 1968
1.758
-0.51
-22.49%
jan 1, 1969
1.723
-0.035
-1.98%
jan 1, 1970
1.696
-0.027
-1.55%
jan 1, 1971
1.553
-0.143
-8.46%
jan 1, 1972
1.704
+0.152
9.77%
jan 1, 1973
1.795
+0.091
5.31%
jan 1, 1974
1.932
+0.137
7.65%
jan 1, 1975
2.785
+0.853
44.16%
jan 1, 1976
4.053
+1.268
45.51%
jan 1, 1977
4.813
+0.76
18.74%
jan 1, 1978
5.325
+0.512
10.64%
jan 1, 1979
5.196
-0.128
-2.41%
jan 1, 1980
4.84
-0.357
-6.86%
jan 1, 1981
5.058
+0.218
4.51%
jan 1, 1982
5.919
+0.861
17.03%
jan 1, 1983
7.133
+1.214
20.51%
jan 1, 1984
6.192
-0.941
-13.19%
jan 1, 1985
4.745
-1.447
-23.37%
jan 1, 1986
3.916
-0.829
-17.47%
jan 1, 1987
3.291
-0.625
-15.95%
jan 1, 1988
2.946
-0.345
-10.48%
jan 1, 1989
2.819
-0.127
-4.32%
jan 1, 1990
2.761
-0.058
-2.07%
jan 1, 1991
2.455
-0.306
-11.1%
jan 1, 1992
2.969
+0.514
20.95%
jan 1, 1993
3.004
+0.036
1.2%
jan 1, 1994
2.868
-0.136
-4.54%
jan 1, 1995
2.444
-0.424
-14.78%
jan 1, 1996
2.255
-0.189
-7.75%
jan 1, 1997
2.391
+0.136
6.05%
jan 1, 1998
2.408
+0.017
0.7%
jan 1, 1999
2.503
+0.095
3.95%
jan 1, 2000
2.064
-0.439
-17.56%
jan 1, 2001
1.742
-0.322
-15.6%
jan 1, 2002
1.845
+0.104
5.95%
jan 1, 2003
1.882
+0.037
1.99%
jan 1, 2004
1.77
-0.111
-5.92%
jan 1, 2005
1.861
+0.09
5.09%
jan 1, 2006
2.345
+0.484
26.02%
jan 1, 2007
2.657
+0.312
13.32%
jan 1, 2008
2.952
+0.295
11.11%
jan 1, 2009
3.266
+0.314
10.64%
jan 1, 2010
3.562
+0.295
9.04%
jan 1, 2011
3.185
-0.377
-10.59%
jan 1, 2012
3.157
-0.028
-0.87%
jan 1, 2013
3.57
+0.413
13.08%
jan 1, 2014
3.723
+0.153
4.28%
jan 1, 2015
3.654
-0.068
-1.84%
Ranking of countries by current statistics by years


Comments: