29
/
en
AIzaSyAYiBZKx7MnpbEhh9jyipgxe19OcubqV5w
April 1, 2024
227636
Qatar
QAT
true
2
1
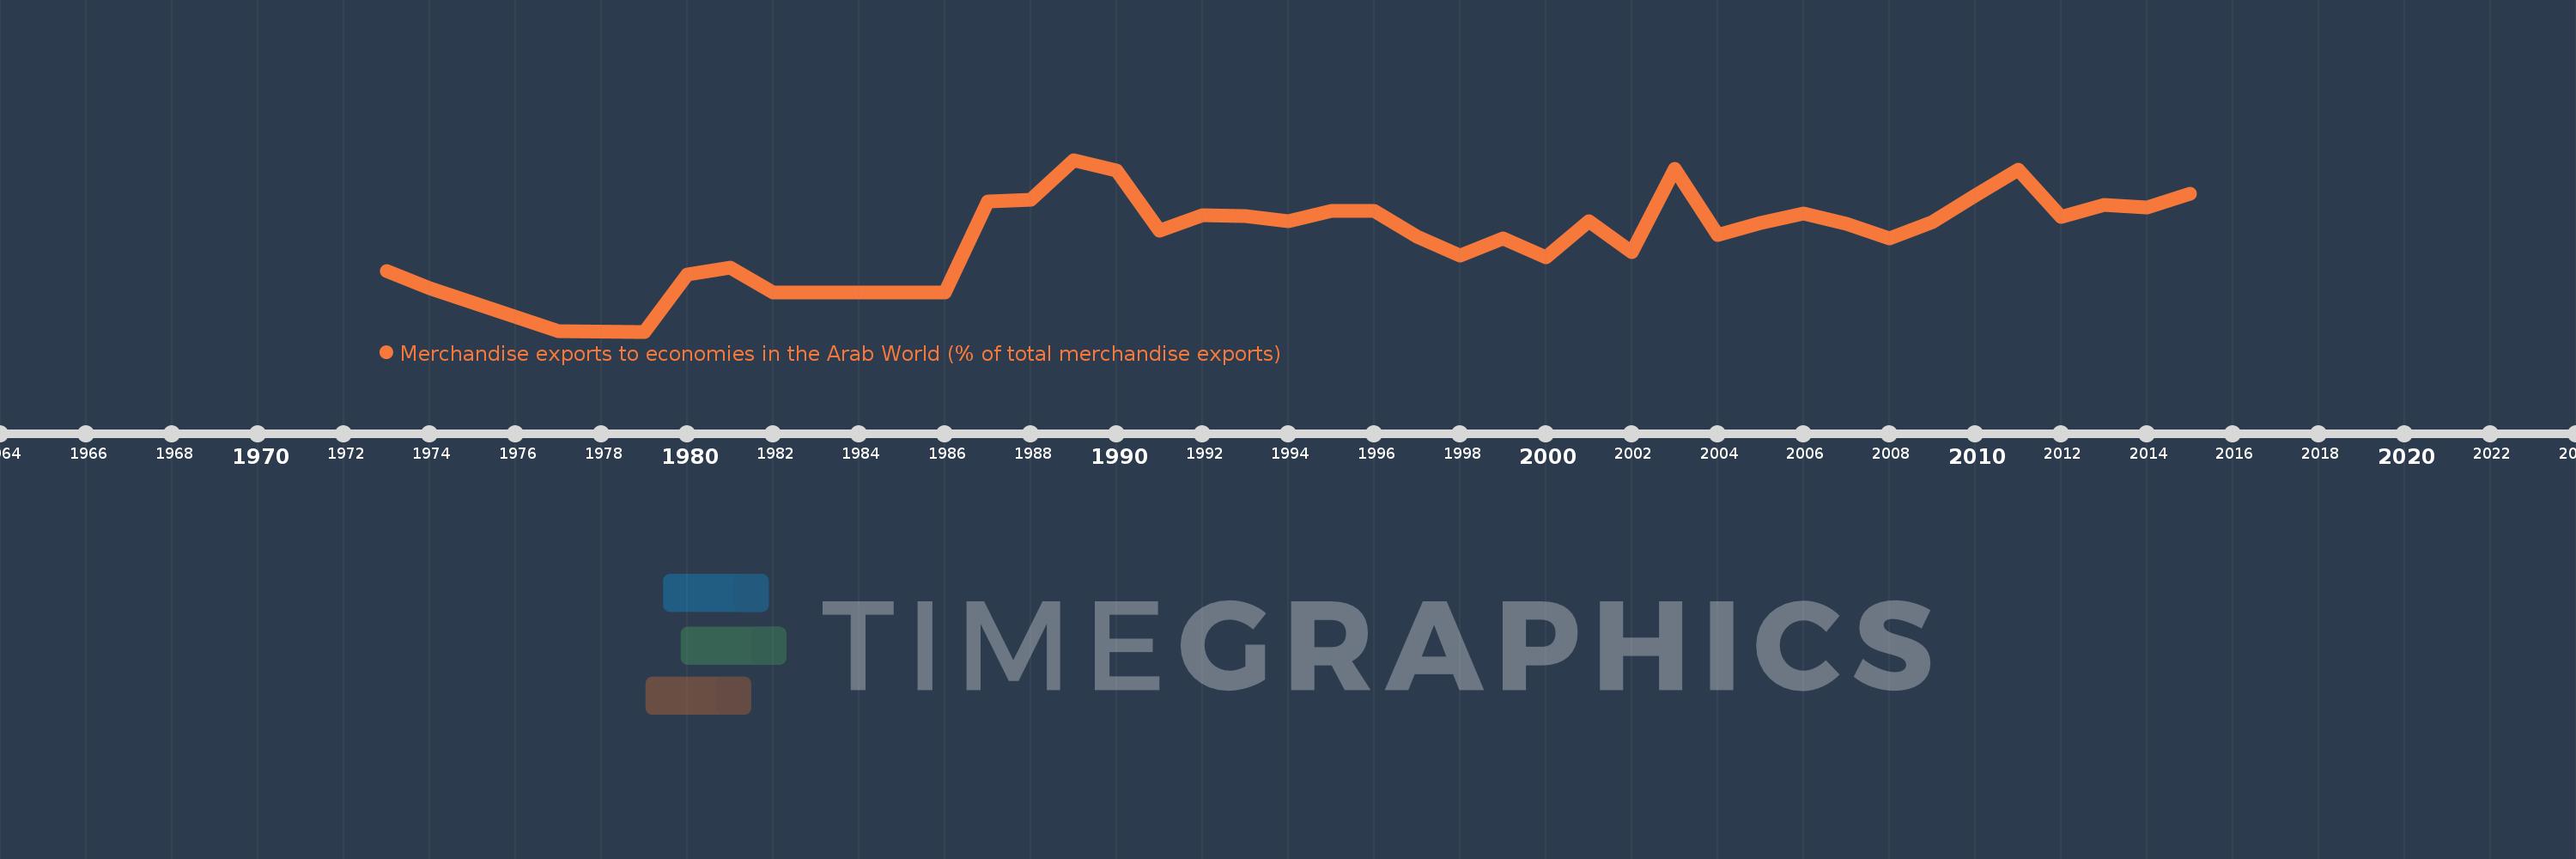
Merchandise exports to economies in the Arab World (% of total merchandise exports)
2015,2014,2013,2012,2011,2010,2009,2008,2007,2006,2005,2004,2003,2002,2001,2000,1999,1998,1997,1996,1995,1994,1993,1992,1991,1990,1989,1988,1987,1986,1985,1984,1983,1982,1981,1980,1979,1977,1974,1973
This statistics in other country:
AfghanistanAlbaniaAlgeriaAngolaArab WorldArgentinaArmeniaArubaAustraliaAustriaAzerbaijanBahamas, TheBahrainBangladeshBarbadosBelarusBelgiumBelizeBeninBermudaBoliviaBosnia and HerzegovinaBrazilBrunei DarussalamBulgariaBurkina FasoBurundiCabo VerdeCambodiaCameroonCanadaCaribbean small statesCentral African RepublicCentral Europe and the BalticsChadChileChinaColombiaComorosCongo, Dem. Rep.Congo, Rep.Costa RicaCote d'IvoireCroatiaCubaCyprusCzech RepublicDenmarkDjiboutiDominicaDominican RepublicEarly-demographic dividendEast Asia & PacificEast Asia & Pacific (excluding high income)East Asia & Pacific (IDA & IBRD countries)EcuadorEgypt, Arab Rep.El SalvadorEstoniaEthiopiaEuro areaEurope & Central AsiaEurope & Central Asia (excluding high income)Europe & Central Asia (IDA & IBRD countries)European UnionFijiFinlandFragile and conflict affected situationsFranceGabonGambia, TheGeorgiaGermanyGhanaGreeceGreenlandGrenadaGuatemalaGuineaGuinea-BissauGuyanaHaitiHeavily indebted poor countries (HIPC)High incomeHondurasHong Kong SAR, ChinaHungaryIBRD onlyIcelandIDA & IBRD totalIDA blendIDA onlyIDA totalIndiaIndonesiaIran, Islamic Rep.IraqIrelandIsraelItalyJamaicaJapanJordanKazakhstanKenyaKorea, Dem. People’s Rep.Korea, Rep.KosovoKuwaitKyrgyz RepublicLao PDRLate-demographic dividendLatin America & Caribbean Latin America & Caribbean (excluding high income)Latin America & the Caribbean (IDA & IBRD countries)LatviaLeast developed countries: UN classificationLebanonLiberiaLibyaLithuaniaLow & middle incomeLow incomeLower middle incomeLuxembourgMacao SAR, ChinaMacedonia, FYRMadagascarMalawiMalaysiaMaldivesMaliMaltaMauritaniaMauritiusMexicoMiddle East & North AfricaMiddle East & North Africa (excluding high income)Middle East & North Africa (IDA & IBRD countries)Middle incomeMoldovaMongoliaMontenegroMoroccoMozambiqueMyanmarNepalNetherlandsNew CaledoniaNew ZealandNicaraguaNigerNigeriaNorth AmericaNorwayOECD membersOmanOther small statesPacific island small statesPakistanPanamaPapua New GuineaParaguayPeruPhilippinesPolandPortugalPost-demographic dividendPre-demographic dividendQatarRomaniaRussian FederationRwandaSamoaSaudi ArabiaSenegalSerbiaSeychellesSierra LeoneSingaporeSlovak RepublicSloveniaSmall statesSomaliaSouth AfricaSouth AsiaSouth Asia (IDA & IBRD)SpainSri LankaSt. LuciaSt. Vincent and the GrenadinesSub-Saharan Africa Sub-Saharan Africa (excluding high income)Sub-Saharan Africa (IDA & IBRD countries)SudanSurinameSwedenSwitzerlandSyrian Arab RepublicTajikistanTanzaniaThailandTogoTrinidad and TobagoTunisiaTurkeyTurkmenistanUgandaUkraineUnited Arab EmiratesUnited KingdomUnited StatesUpper middle incomeUruguayUzbekistanVenezuela, RBVietnamWorldYemen, Rep.ZambiaZimbabwe Timeline:
This timeline shows a graph from 1973 to 2015 of Qatar. No data until 1972. Number of actual observations by date: 40.
Source name:
World Development Indicators
Source organization:
World Bank staff estimates based data from International Monetary Fund's Direction of Trade database.
Categories, topics:
Private Sector, Trade
Last updated:
apr 23, 2017
Indicators value changes by year
At the date of observation
Value
Absolute change
Change from previous value
jan 1, 1973
3.435
+3.435
0.0%
jan 1, 1974
2.458
-0.977
-28.45%
jan 1, 1977
0.047
-2.411
-98.08%
jan 1, 1979
0.0
-0.047
-100.0%
jan 1, 1980
3.263
+3.263
%
jan 1, 1981
3.621
+0.359
11.0%
jan 1, 1982
2.238
-1.384
-38.21%
jan 1, 1983
2.238
+0.0
0.0%
jan 1, 1984
2.238
0.0
0.0%
jan 1, 1985
2.238
0.0
0.0%
jan 1, 1986
2.238
+0.0
0.0%
jan 1, 1987
7.394
+5.156
230.42%
jan 1, 1988
7.485
+0.091
1.23%
jan 1, 1989
9.759
+2.275
30.39%
jan 1, 1990
9.127
-0.632
-6.48%
jan 1, 1991
5.731
-3.396
-37.21%
jan 1, 1992
6.63
+0.899
15.7%
jan 1, 1993
6.58
-0.05
-0.75%
jan 1, 1994
6.279
-0.302
-4.59%
jan 1, 1995
6.853
+0.574
9.14%
jan 1, 1996
6.87
+0.017
0.25%
jan 1, 1997
5.386
-1.484
-21.6%
jan 1, 1998
4.309
-1.077
-19.99%
jan 1, 1999
5.286
+0.977
22.68%
jan 1, 2000
4.199
-1.087
-20.57%
jan 1, 2001
6.287
+2.088
49.73%
jan 1, 2002
4.533
-1.754
-27.9%
jan 1, 2003
9.237
+4.704
103.77%
jan 1, 2004
5.47
-3.766
-40.78%
jan 1, 2005
6.161
+0.691
12.62%
jan 1, 2006
6.714
+0.553
8.98%
jan 1, 2007
6.105
-0.609
-9.07%
jan 1, 2008
5.287
-0.818
-13.4%
jan 1, 2009
6.242
+0.955
18.07%
jan 1, 2010
7.715
+1.473
23.59%
jan 1, 2011
9.218
+1.503
19.48%
jan 1, 2012
6.508
-2.71
-29.4%
jan 1, 2013
7.204
+0.696
10.7%
jan 1, 2014
7.049
-0.156
-2.16%
jan 1, 2015
7.822
+0.773
10.97%
Ranking of countries by current statistics by years


Comments: