29
/
en
AIzaSyAYiBZKx7MnpbEhh9jyipgxe19OcubqV5w
April 1, 2024
201853
Morocco
MAR
true
2
1
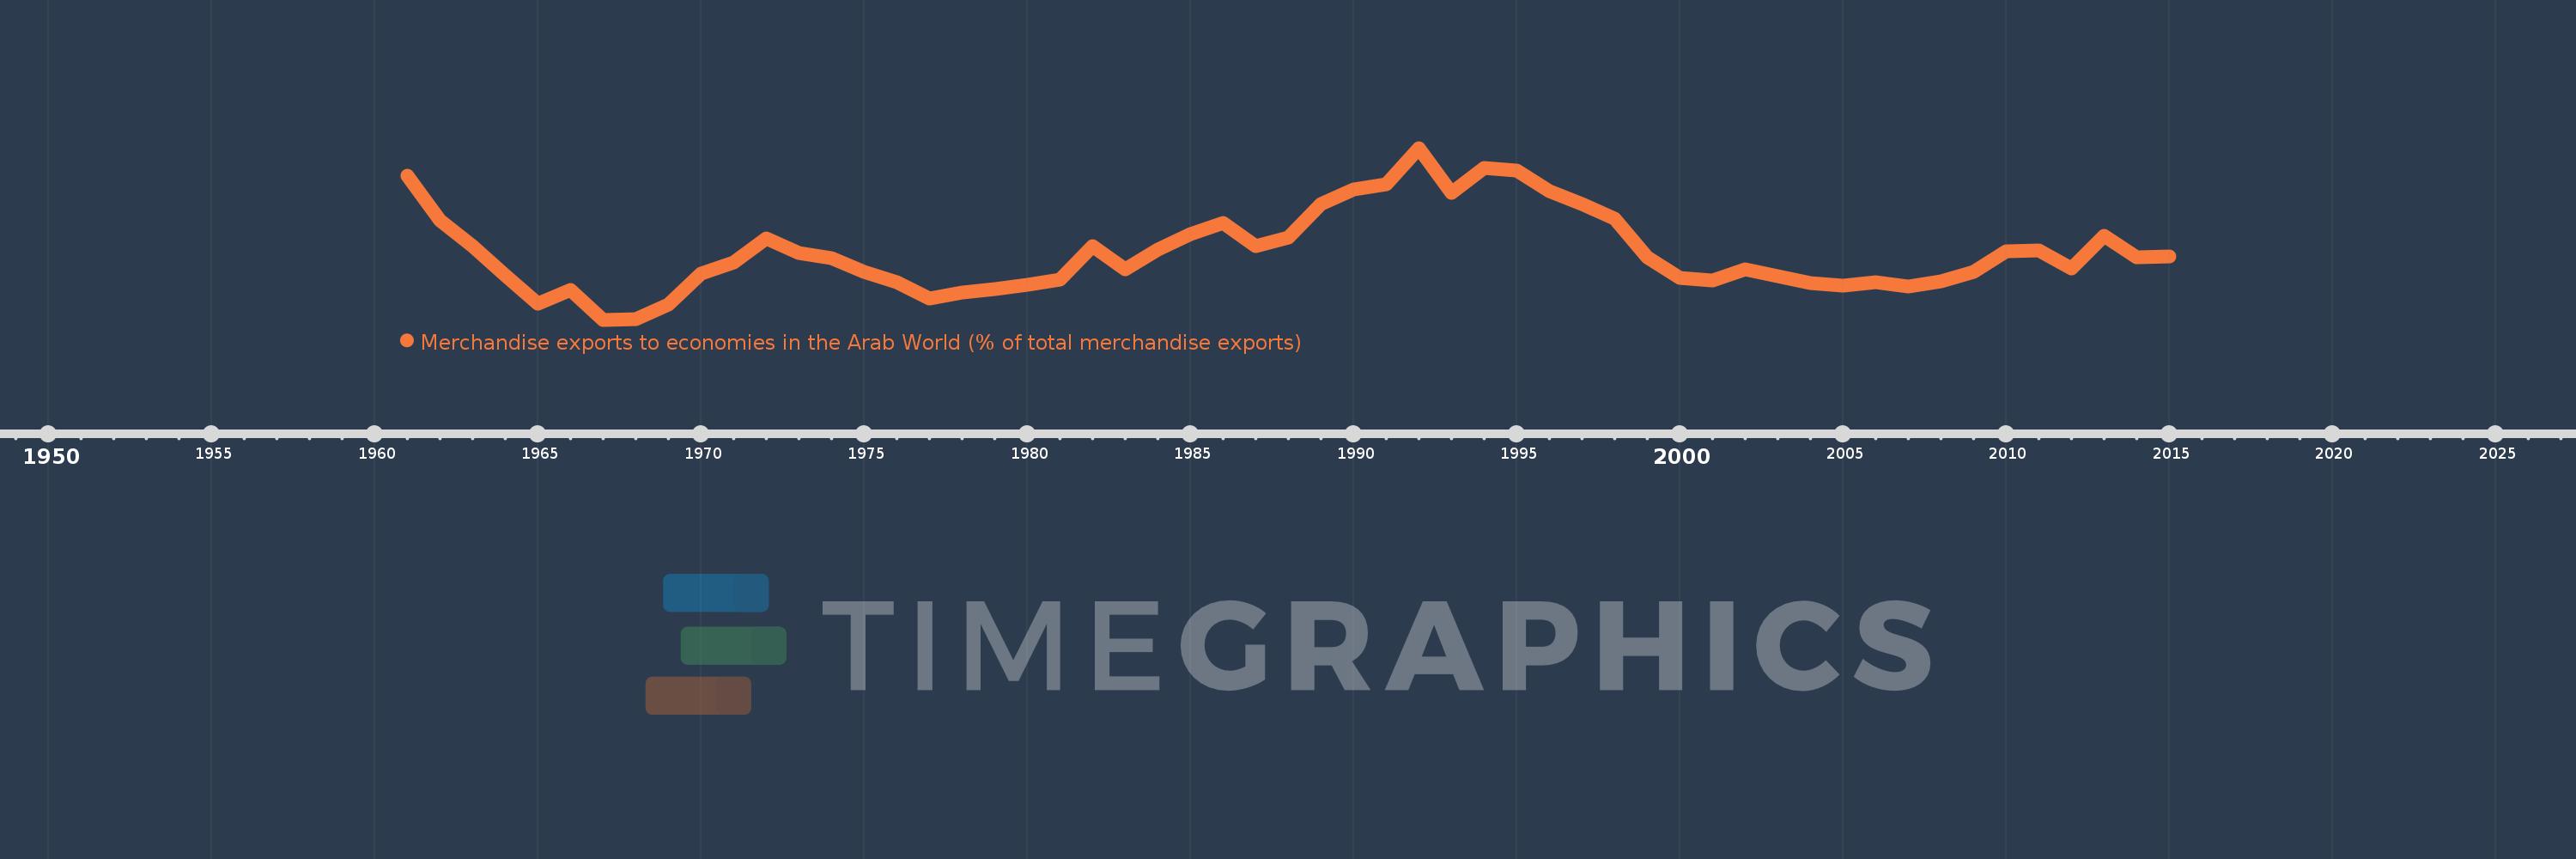
Merchandise exports to economies in the Arab World (% of total merchandise exports)
2015,2014,2013,2012,2011,2010,2009,2008,2007,2006,2005,2004,2003,2002,2001,2000,1999,1998,1997,1996,1995,1994,1993,1992,1991,1990,1989,1988,1987,1986,1985,1984,1983,1982,1981,1980,1979,1978,1977,1976,1975,1974,1973,1972,1971,1970,1969,1968,1967,1966,1965,1964,1963,1962,1961
This statistics in other country:
AfghanistanAlbaniaAlgeriaAngolaArab WorldArgentinaArmeniaArubaAustraliaAustriaAzerbaijanBahamas, TheBahrainBangladeshBarbadosBelarusBelgiumBelizeBeninBermudaBoliviaBosnia and HerzegovinaBrazilBrunei DarussalamBulgariaBurkina FasoBurundiCabo VerdeCambodiaCameroonCanadaCaribbean small statesCentral African RepublicCentral Europe and the BalticsChadChileChinaColombiaComorosCongo, Dem. Rep.Congo, Rep.Costa RicaCote d'IvoireCroatiaCubaCyprusCzech RepublicDenmarkDjiboutiDominicaDominican RepublicEarly-demographic dividendEast Asia & PacificEast Asia & Pacific (excluding high income)East Asia & Pacific (IDA & IBRD countries)EcuadorEgypt, Arab Rep.El SalvadorEstoniaEthiopiaEuro areaEurope & Central AsiaEurope & Central Asia (excluding high income)Europe & Central Asia (IDA & IBRD countries)European UnionFijiFinlandFragile and conflict affected situationsFranceGabonGambia, TheGeorgiaGermanyGhanaGreeceGreenlandGrenadaGuatemalaGuineaGuinea-BissauGuyanaHaitiHeavily indebted poor countries (HIPC)High incomeHondurasHong Kong SAR, ChinaHungaryIBRD onlyIcelandIDA & IBRD totalIDA blendIDA onlyIDA totalIndiaIndonesiaIran, Islamic Rep.IraqIrelandIsraelItalyJamaicaJapanJordanKazakhstanKenyaKorea, Dem. People’s Rep.Korea, Rep.KosovoKuwaitKyrgyz RepublicLao PDRLate-demographic dividendLatin America & Caribbean Latin America & Caribbean (excluding high income)Latin America & the Caribbean (IDA & IBRD countries)LatviaLeast developed countries: UN classificationLebanonLiberiaLibyaLithuaniaLow & middle incomeLow incomeLower middle incomeLuxembourgMacao SAR, ChinaMacedonia, FYRMadagascarMalawiMalaysiaMaldivesMaliMaltaMauritaniaMauritiusMexicoMiddle East & North AfricaMiddle East & North Africa (excluding high income)Middle East & North Africa (IDA & IBRD countries)Middle incomeMoldovaMongoliaMontenegroMoroccoMozambiqueMyanmarNepalNetherlandsNew CaledoniaNew ZealandNicaraguaNigerNigeriaNorth AmericaNorwayOECD membersOmanOther small statesPacific island small statesPakistanPanamaPapua New GuineaParaguayPeruPhilippinesPolandPortugalPost-demographic dividendPre-demographic dividendQatarRomaniaRussian FederationRwandaSamoaSaudi ArabiaSenegalSerbiaSeychellesSierra LeoneSingaporeSlovak RepublicSloveniaSmall statesSomaliaSouth AfricaSouth AsiaSouth Asia (IDA & IBRD)SpainSri LankaSt. LuciaSt. Vincent and the GrenadinesSub-Saharan Africa Sub-Saharan Africa (excluding high income)Sub-Saharan Africa (IDA & IBRD countries)SudanSurinameSwedenSwitzerlandSyrian Arab RepublicTajikistanTanzaniaThailandTogoTrinidad and TobagoTunisiaTurkeyTurkmenistanUgandaUkraineUnited Arab EmiratesUnited KingdomUnited StatesUpper middle incomeUruguayUzbekistanVenezuela, RBVietnamWorldYemen, Rep.ZambiaZimbabwe Timeline:
This timeline shows a graph from 1961 to 2015 of Morocco. No data until 1960. Number of actual observations by date: 55.
Source name:
World Development Indicators
Source organization:
World Bank staff estimates based data from International Monetary Fund's Direction of Trade database.
Categories, topics:
Private Sector, Trade
Last updated:
apr 23, 2017
Indicators value changes by year
At the date of observation
Value
Absolute change
Change from previous value
jan 1, 1961
8.57
+8.57
0.0%
jan 1, 1962
6.405
-2.164
-25.26%
jan 1, 1963
5.155
-1.25
-19.52%
jan 1, 1964
3.753
-1.402
-27.19%
jan 1, 1965
2.371
-1.382
-36.83%
jan 1, 1966
3.052
+0.681
28.73%
jan 1, 1967
1.607
-1.445
-47.34%
jan 1, 1968
1.627
+0.02
1.25%
jan 1, 1969
2.335
+0.707
43.46%
jan 1, 1970
3.817
+1.483
63.51%
jan 1, 1971
4.36
+0.542
14.21%
jan 1, 1972
5.543
+1.183
27.14%
jan 1, 1973
4.842
-0.7
-12.64%
jan 1, 1974
4.595
-0.248
-5.11%
jan 1, 1975
3.917
-0.678
-14.75%
jan 1, 1976
3.436
-0.481
-12.29%
jan 1, 1977
2.65
-0.786
-22.87%
jan 1, 1978
2.911
+0.261
9.87%
jan 1, 1979
3.086
+0.175
6.01%
jan 1, 1980
3.305
+0.219
7.1%
jan 1, 1981
3.538
+0.233
7.05%
jan 1, 1982
5.174
+1.636
46.23%
jan 1, 1983
4.033
-1.141
-22.06%
jan 1, 1984
4.978
+0.945
23.45%
jan 1, 1985
5.74
+0.762
15.31%
jan 1, 1986
6.262
+0.521
9.08%
jan 1, 1987
5.148
-1.114
-17.79%
jan 1, 1988
5.582
+0.434
8.43%
jan 1, 1989
7.178
+1.596
28.6%
jan 1, 1990
7.88
+0.701
9.77%
jan 1, 1991
8.126
+0.246
3.13%
jan 1, 1992
9.889
+1.763
21.69%
jan 1, 1993
7.727
-2.162
-21.86%
jan 1, 1994
8.93
+1.203
15.56%
jan 1, 1995
8.799
-0.131
-1.47%
jan 1, 1996
7.816
-0.982
-11.16%
jan 1, 1997
7.196
-0.62
-7.94%
jan 1, 1998
6.475
-0.721
-10.02%
jan 1, 1999
4.633
-1.842
-28.45%
jan 1, 2000
3.612
-1.021
-22.03%
jan 1, 2001
3.484
-0.128
-3.54%
jan 1, 2002
4.04
+0.556
15.95%
jan 1, 2003
3.727
-0.313
-7.74%
jan 1, 2004
3.364
-0.363
-9.74%
jan 1, 2005
3.27
-0.094
-2.81%
jan 1, 2006
3.406
+0.136
4.17%
jan 1, 2007
3.207
-0.2
-5.86%
jan 1, 2008
3.469
+0.262
8.17%
jan 1, 2009
3.896
+0.427
12.3%
jan 1, 2010
4.899
+1.004
25.76%
jan 1, 2011
4.95
+0.051
1.04%
jan 1, 2012
4.09
-0.861
-17.39%
jan 1, 2013
5.663
+1.573
38.47%
jan 1, 2014
4.604
-1.059
-18.71%
jan 1, 2015
4.676
+0.073
1.58%
Ranking of countries by current statistics by years


Comments: