29
/
en
AIzaSyAYiBZKx7MnpbEhh9jyipgxe19OcubqV5w
April 1, 2024
185456
Madagascar
MDG
true
2
1
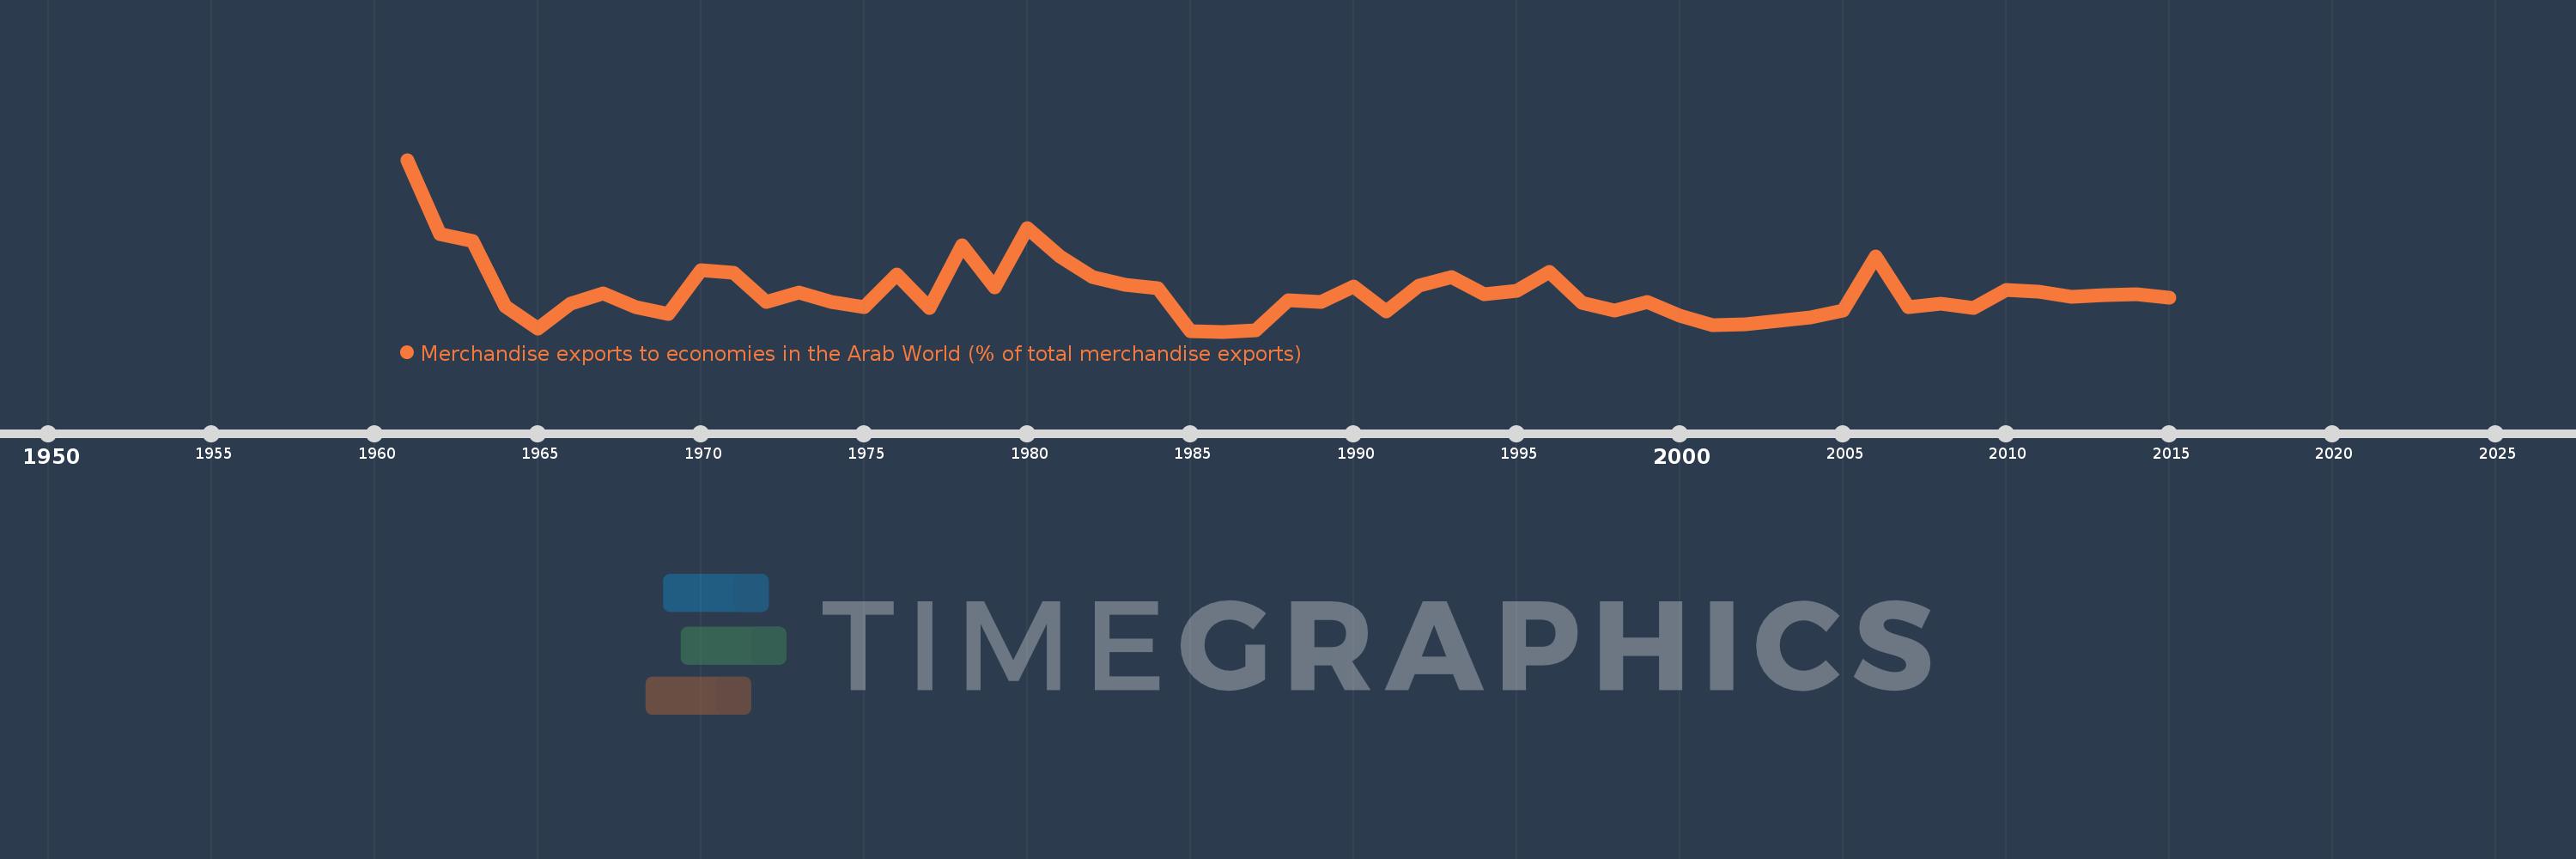
Merchandise exports to economies in the Arab World (% of total merchandise exports)
2015,2014,2013,2012,2011,2010,2009,2008,2007,2006,2005,2004,2003,2002,2001,2000,1999,1998,1997,1996,1995,1994,1993,1992,1991,1990,1989,1988,1987,1986,1985,1984,1983,1982,1981,1980,1979,1978,1977,1976,1975,1974,1973,1972,1971,1970,1969,1968,1967,1966,1965,1964,1963,1962,1961
This statistics in other country:
AfghanistanAlbaniaAlgeriaAngolaArab WorldArgentinaArmeniaArubaAustraliaAustriaAzerbaijanBahamas, TheBahrainBangladeshBarbadosBelarusBelgiumBelizeBeninBermudaBoliviaBosnia and HerzegovinaBrazilBrunei DarussalamBulgariaBurkina FasoBurundiCabo VerdeCambodiaCameroonCanadaCaribbean small statesCentral African RepublicCentral Europe and the BalticsChadChileChinaColombiaComorosCongo, Dem. Rep.Congo, Rep.Costa RicaCote d'IvoireCroatiaCubaCyprusCzech RepublicDenmarkDjiboutiDominicaDominican RepublicEarly-demographic dividendEast Asia & PacificEast Asia & Pacific (excluding high income)East Asia & Pacific (IDA & IBRD countries)EcuadorEgypt, Arab Rep.El SalvadorEstoniaEthiopiaEuro areaEurope & Central AsiaEurope & Central Asia (excluding high income)Europe & Central Asia (IDA & IBRD countries)European UnionFijiFinlandFragile and conflict affected situationsFranceGabonGambia, TheGeorgiaGermanyGhanaGreeceGreenlandGrenadaGuatemalaGuineaGuinea-BissauGuyanaHaitiHeavily indebted poor countries (HIPC)High incomeHondurasHong Kong SAR, ChinaHungaryIBRD onlyIcelandIDA & IBRD totalIDA blendIDA onlyIDA totalIndiaIndonesiaIran, Islamic Rep.IraqIrelandIsraelItalyJamaicaJapanJordanKazakhstanKenyaKorea, Dem. People’s Rep.Korea, Rep.KosovoKuwaitKyrgyz RepublicLao PDRLate-demographic dividendLatin America & Caribbean Latin America & Caribbean (excluding high income)Latin America & the Caribbean (IDA & IBRD countries)LatviaLeast developed countries: UN classificationLebanonLiberiaLibyaLithuaniaLow & middle incomeLow incomeLower middle incomeLuxembourgMacao SAR, ChinaMacedonia, FYRMadagascarMalawiMalaysiaMaldivesMaliMaltaMauritaniaMauritiusMexicoMiddle East & North AfricaMiddle East & North Africa (excluding high income)Middle East & North Africa (IDA & IBRD countries)Middle incomeMoldovaMongoliaMontenegroMoroccoMozambiqueMyanmarNepalNetherlandsNew CaledoniaNew ZealandNicaraguaNigerNigeriaNorth AmericaNorwayOECD membersOmanOther small statesPacific island small statesPakistanPanamaPapua New GuineaParaguayPeruPhilippinesPolandPortugalPost-demographic dividendPre-demographic dividendQatarRomaniaRussian FederationRwandaSamoaSaudi ArabiaSenegalSerbiaSeychellesSierra LeoneSingaporeSlovak RepublicSloveniaSmall statesSomaliaSouth AfricaSouth AsiaSouth Asia (IDA & IBRD)SpainSri LankaSt. LuciaSt. Vincent and the GrenadinesSub-Saharan Africa Sub-Saharan Africa (excluding high income)Sub-Saharan Africa (IDA & IBRD countries)SudanSurinameSwedenSwitzerlandSyrian Arab RepublicTajikistanTanzaniaThailandTogoTrinidad and TobagoTunisiaTurkeyTurkmenistanUgandaUkraineUnited Arab EmiratesUnited KingdomUnited StatesUpper middle incomeUruguayUzbekistanVenezuela, RBVietnamWorldYemen, Rep.ZambiaZimbabwe Timeline:
This timeline shows a graph from 1961 to 2015 of Madagascar. No data until 1960. Number of actual observations by date: 55.
Source name:
World Development Indicators
Source organization:
World Bank staff estimates based data from International Monetary Fund's Direction of Trade database.
Categories, topics:
Private Sector, Trade
Last updated:
apr 23, 2017
Indicators value changes by year
At the date of observation
Value
Absolute change
Change from previous value
jan 1, 1961
10.97
+10.97
0.0%
jan 1, 1962
6.233
-4.737
-43.18%
jan 1, 1963
5.817
-0.417
-6.68%
jan 1, 1964
1.677
-4.139
-71.16%
jan 1, 1965
0.231
-1.446
-86.23%
jan 1, 1966
1.858
+1.627
704.65%
jan 1, 1967
2.466
+0.608
32.72%
jan 1, 1968
1.609
-0.857
-34.74%
jan 1, 1969
1.176
-0.433
-26.9%
jan 1, 1970
3.948
+2.772
235.61%
jan 1, 1971
3.778
-0.171
-4.32%
jan 1, 1972
1.958
-1.819
-48.16%
jan 1, 1973
2.563
+0.605
30.89%
jan 1, 1974
1.926
-0.637
-24.86%
jan 1, 1975
1.628
-0.298
-15.45%
jan 1, 1976
3.698
+2.069
127.08%
jan 1, 1977
1.56
-2.138
-57.81%
jan 1, 1978
5.561
+4.001
256.46%
jan 1, 1979
2.856
-2.705
-48.64%
jan 1, 1980
6.617
+3.761
131.67%
jan 1, 1981
4.861
-1.756
-26.54%
jan 1, 1982
3.532
-1.329
-27.34%
jan 1, 1983
3.062
-0.47
-13.31%
jan 1, 1984
2.791
-0.271
-8.84%
jan 1, 1985
0.095
-2.696
-96.6%
jan 1, 1986
0.064
-0.031
-32.46%
jan 1, 1987
0.166
+0.102
159.59%
jan 1, 1988
2.053
+1.887
1.13K%
jan 1, 1989
1.97
-0.084
-4.07%
jan 1, 1990
2.907
+0.938
47.6%
jan 1, 1991
1.333
-1.575
-54.16%
jan 1, 1992
2.977
+1.645
123.41%
jan 1, 1993
3.532
+0.555
18.64%
jan 1, 1994
2.452
-1.08
-30.58%
jan 1, 1995
2.656
+0.204
8.31%
jan 1, 1996
3.842
+1.187
44.69%
jan 1, 1997
1.897
-1.945
-50.63%
jan 1, 1998
1.41
-0.487
-25.68%
jan 1, 1999
1.928
+0.518
36.74%
jan 1, 2000
1.082
-0.846
-43.9%
jan 1, 2001
0.478
-0.603
-55.79%
jan 1, 2002
0.521
+0.043
8.95%
jan 1, 2003
0.751
+0.23
44.12%
jan 1, 2004
0.989
+0.238
31.64%
jan 1, 2005
1.387
+0.398
40.29%
jan 1, 2006
4.859
+3.472
250.39%
jan 1, 2007
1.628
-3.231
-66.5%
jan 1, 2008
1.862
+0.234
14.4%
jan 1, 2009
1.582
-0.28
-15.02%
jan 1, 2010
2.722
+1.139
72.01%
jan 1, 2011
2.586
-0.136
-4.99%
jan 1, 2012
2.252
-0.334
-12.9%
jan 1, 2013
2.399
+0.147
6.52%
jan 1, 2014
2.458
+0.058
2.44%
jan 1, 2015
2.203
-0.254
-10.34%
Ranking of countries by current statistics by years


Comments: