29
/
en
AIzaSyAYiBZKx7MnpbEhh9jyipgxe19OcubqV5w
April 1, 2024
112533
Costa Rica
CRI
true
2
1
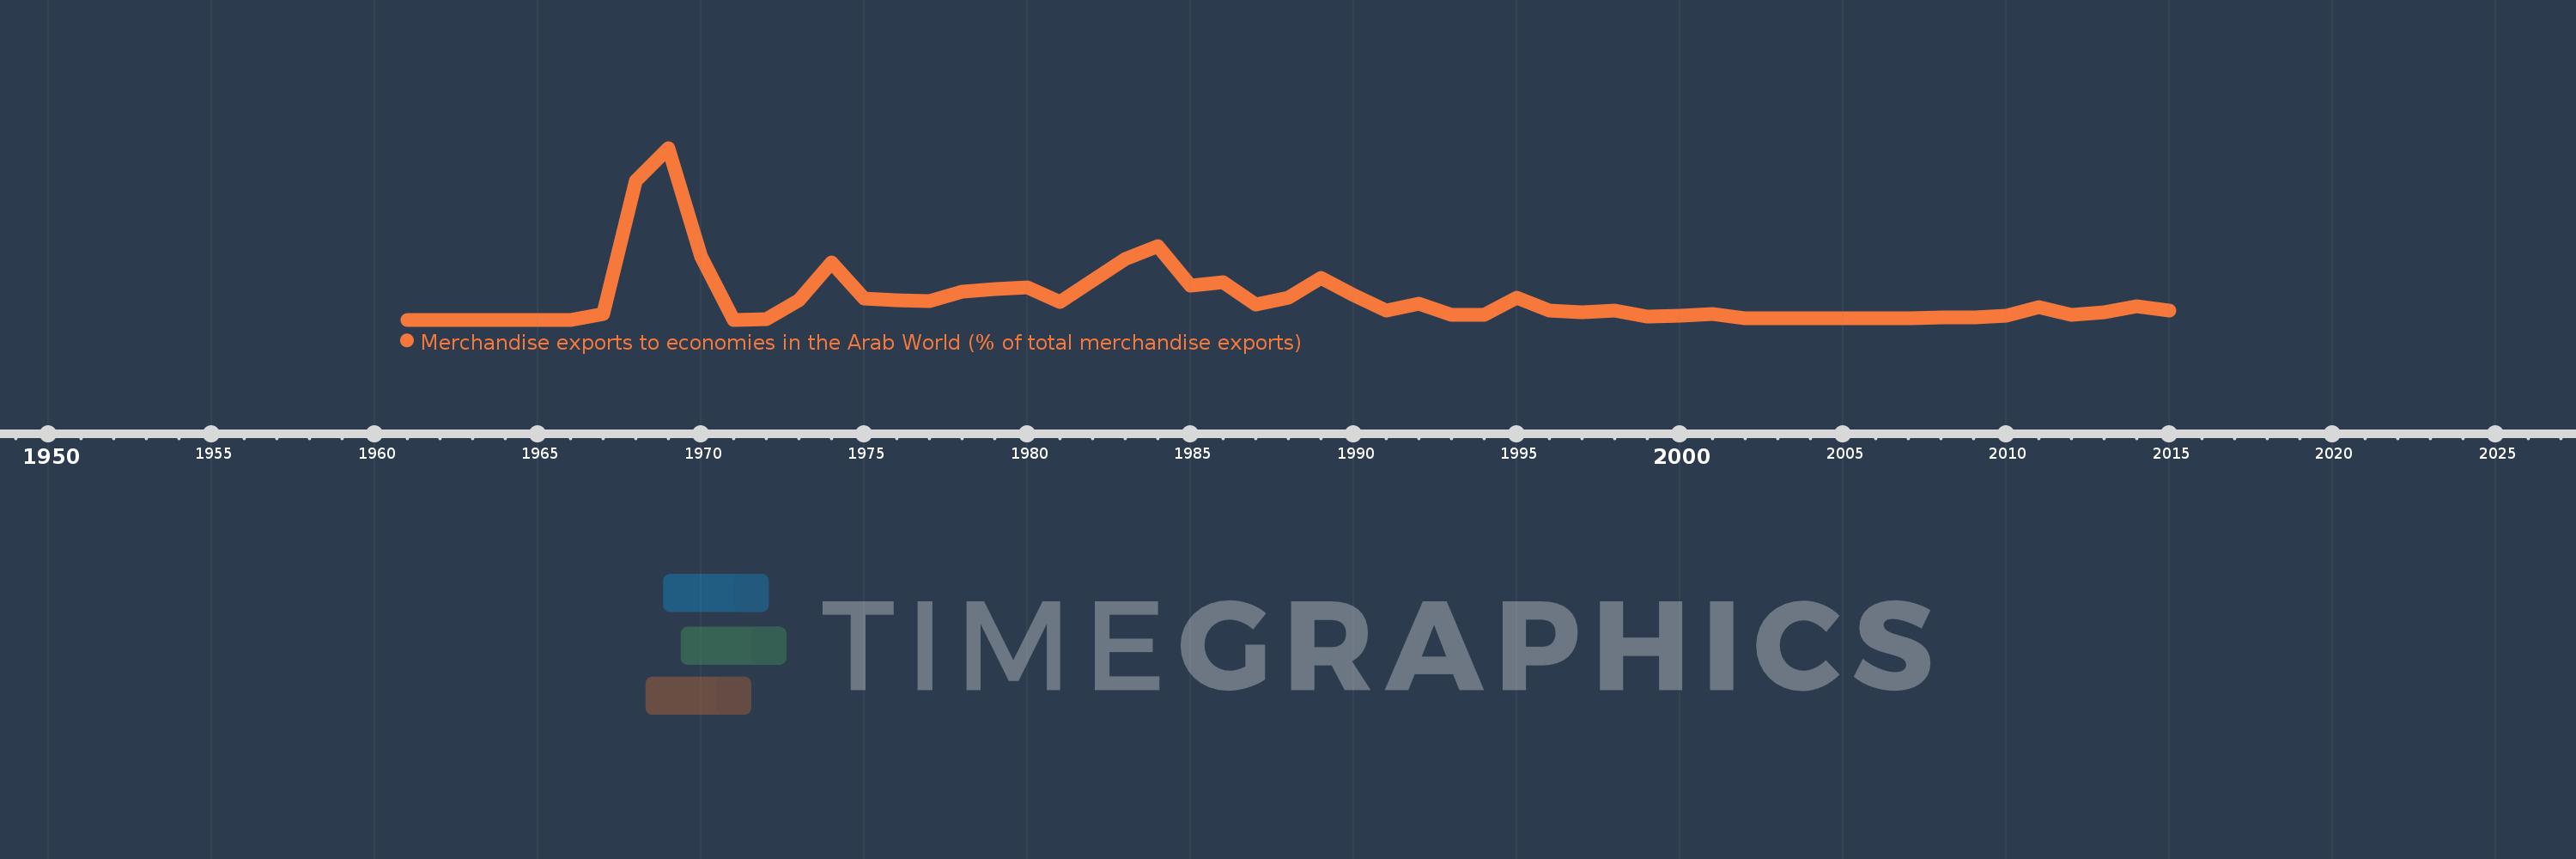
Merchandise exports to economies in the Arab World (% of total merchandise exports)
2015,2014,2013,2012,2011,2010,2009,2008,2007,2006,2005,2004,2003,2002,2001,2000,1999,1998,1997,1996,1995,1994,1993,1992,1991,1990,1989,1988,1987,1986,1985,1984,1983,1982,1981,1980,1979,1978,1977,1976,1975,1974,1973,1972,1971,1970,1969,1968,1967,1966,1965,1964,1963,1962,1961
This statistics in other country:
AfghanistanAlbaniaAlgeriaAngolaArab WorldArgentinaArmeniaArubaAustraliaAustriaAzerbaijanBahamas, TheBahrainBangladeshBarbadosBelarusBelgiumBelizeBeninBermudaBoliviaBosnia and HerzegovinaBrazilBrunei DarussalamBulgariaBurkina FasoBurundiCabo VerdeCambodiaCameroonCanadaCaribbean small statesCentral African RepublicCentral Europe and the BalticsChadChileChinaColombiaComorosCongo, Dem. Rep.Congo, Rep.Costa RicaCote d'IvoireCroatiaCubaCyprusCzech RepublicDenmarkDjiboutiDominicaDominican RepublicEarly-demographic dividendEast Asia & PacificEast Asia & Pacific (excluding high income)East Asia & Pacific (IDA & IBRD countries)EcuadorEgypt, Arab Rep.El SalvadorEstoniaEthiopiaEuro areaEurope & Central AsiaEurope & Central Asia (excluding high income)Europe & Central Asia (IDA & IBRD countries)European UnionFijiFinlandFragile and conflict affected situationsFranceGabonGambia, TheGeorgiaGermanyGhanaGreeceGreenlandGrenadaGuatemalaGuineaGuinea-BissauGuyanaHaitiHeavily indebted poor countries (HIPC)High incomeHondurasHong Kong SAR, ChinaHungaryIBRD onlyIcelandIDA & IBRD totalIDA blendIDA onlyIDA totalIndiaIndonesiaIran, Islamic Rep.IraqIrelandIsraelItalyJamaicaJapanJordanKazakhstanKenyaKorea, Dem. People’s Rep.Korea, Rep.KosovoKuwaitKyrgyz RepublicLao PDRLate-demographic dividendLatin America & Caribbean Latin America & Caribbean (excluding high income)Latin America & the Caribbean (IDA & IBRD countries)LatviaLeast developed countries: UN classificationLebanonLiberiaLibyaLithuaniaLow & middle incomeLow incomeLower middle incomeLuxembourgMacao SAR, ChinaMacedonia, FYRMadagascarMalawiMalaysiaMaldivesMaliMaltaMauritaniaMauritiusMexicoMiddle East & North AfricaMiddle East & North Africa (excluding high income)Middle East & North Africa (IDA & IBRD countries)Middle incomeMoldovaMongoliaMontenegroMoroccoMozambiqueMyanmarNepalNetherlandsNew CaledoniaNew ZealandNicaraguaNigerNigeriaNorth AmericaNorwayOECD membersOmanOther small statesPacific island small statesPakistanPanamaPapua New GuineaParaguayPeruPhilippinesPolandPortugalPost-demographic dividendPre-demographic dividendQatarRomaniaRussian FederationRwandaSamoaSaudi ArabiaSenegalSerbiaSeychellesSierra LeoneSingaporeSlovak RepublicSloveniaSmall statesSomaliaSouth AfricaSouth AsiaSouth Asia (IDA & IBRD)SpainSri LankaSt. LuciaSt. Vincent and the GrenadinesSub-Saharan Africa Sub-Saharan Africa (excluding high income)Sub-Saharan Africa (IDA & IBRD countries)SudanSurinameSwedenSwitzerlandSyrian Arab RepublicTajikistanTanzaniaThailandTogoTrinidad and TobagoTunisiaTurkeyTurkmenistanUgandaUkraineUnited Arab EmiratesUnited KingdomUnited StatesUpper middle incomeUruguayUzbekistanVenezuela, RBVietnamWorldYemen, Rep.ZambiaZimbabwe Timeline:
This timeline shows a graph from 1961 to 2015 of Costa Rica. No data until 1960. Number of actual observations by date: 55.
Source name:
World Development Indicators
Source organization:
World Bank staff estimates based data from International Monetary Fund's Direction of Trade database.
Categories, topics:
Private Sector, Trade
Last updated:
apr 23, 2017
Indicators value changes by year
At the date of observation
Value
Absolute change
Change from previous value
jan 1, 1967
0.144
+0.144
%
jan 1, 1968
3.284
+3.14
2.18K%
jan 1, 1969
4.072
+0.788
23.98%
jan 1, 1970
1.494
-2.579
-63.32%
jan 1, 1971
0.0
-1.494
-100.0%
jan 1, 1972
0.007
+0.007
%
jan 1, 1973
0.462
+0.456
6.6K%
jan 1, 1974
1.348
+0.886
191.49%
jan 1, 1975
0.502
-0.846
-62.74%
jan 1, 1976
0.453
-0.049
-9.81%
jan 1, 1977
0.436
-0.017
-3.74%
jan 1, 1978
0.661
+0.225
51.61%
jan 1, 1979
0.729
+0.068
10.22%
jan 1, 1980
0.766
+0.037
5.05%
jan 1, 1981
0.419
-0.346
-45.25%
jan 1, 1982
0.935
+0.516
122.99%
jan 1, 1983
1.447
+0.512
54.81%
jan 1, 1984
1.747
+0.3
20.74%
jan 1, 1985
0.799
-0.948
-54.25%
jan 1, 1986
0.886
+0.086
10.82%
jan 1, 1987
0.355
-0.531
-59.89%
jan 1, 1988
0.52
+0.164
46.23%
jan 1, 1989
1.0
+0.481
92.5%
jan 1, 1990
0.591
-0.409
-40.91%
jan 1, 1991
0.211
-0.38
-64.24%
jan 1, 1992
0.384
+0.173
81.64%
jan 1, 1993
0.125
-0.259
-67.35%
jan 1, 1994
0.111
-0.014
-11.23%
jan 1, 1995
0.515
+0.403
362.53%
jan 1, 1996
0.208
-0.307
-59.65%
jan 1, 1997
0.185
-0.023
-11.07%
jan 1, 1998
0.218
+0.033
17.9%
jan 1, 1999
0.073
-0.145
-66.37%
jan 1, 2000
0.093
+0.02
26.75%
jan 1, 2001
0.144
+0.052
55.52%
jan 1, 2002
0.039
-0.105
-72.75%
jan 1, 2003
0.032
-0.007
-18.88%
jan 1, 2004
0.025
-0.006
-20.14%
jan 1, 2005
0.036
+0.011
41.69%
jan 1, 2006
0.039
+0.002
6.91%
jan 1, 2007
0.03
-0.009
-22.26%
jan 1, 2008
0.047
+0.017
57.51%
jan 1, 2009
0.056
+0.008
17.57%
jan 1, 2010
0.086
+0.031
55.31%
jan 1, 2011
0.309
+0.223
258.21%
jan 1, 2012
0.117
-0.192
-62.15%
jan 1, 2013
0.185
+0.068
58.02%
jan 1, 2014
0.315
+0.13
70.45%
jan 1, 2015
0.228
-0.087
-27.75%
Ranking of countries by current statistics by years


Comments: