29
/
en
AIzaSyAYiBZKx7MnpbEhh9jyipgxe19OcubqV5w
April 1, 2024
102676
Central African Republic
CAF
true
2
1
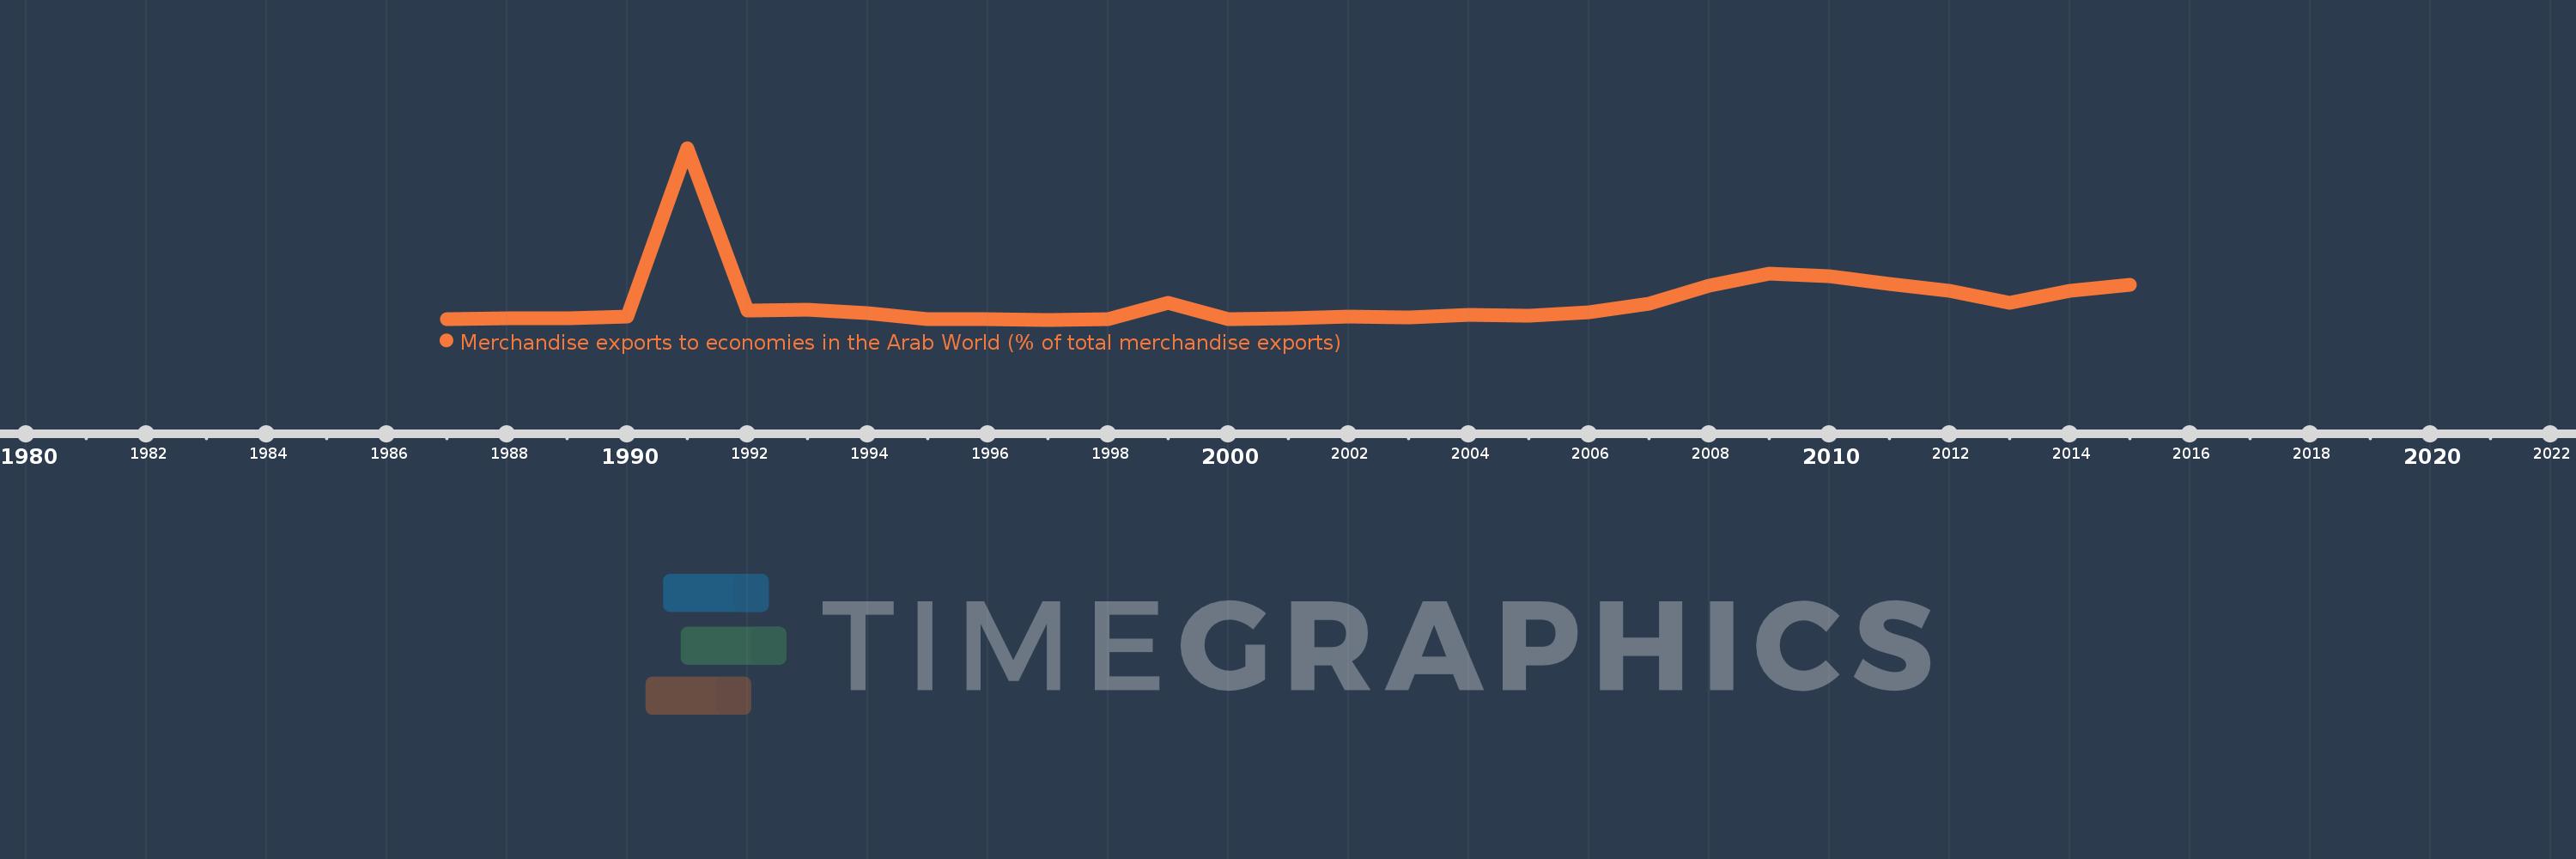
Merchandise exports to economies in the Arab World (% of total merchandise exports)
2015,2014,2013,2012,2011,2010,2009,2008,2007,2006,2005,2004,2003,2002,2001,2000,1999,1998,1997,1996,1995,1994,1993,1992,1991,1990,1989,1988,1987
This statistics in other country:
AfghanistanAlbaniaAlgeriaAngolaArab WorldArgentinaArmeniaArubaAustraliaAustriaAzerbaijanBahamas, TheBahrainBangladeshBarbadosBelarusBelgiumBelizeBeninBermudaBoliviaBosnia and HerzegovinaBrazilBrunei DarussalamBulgariaBurkina FasoBurundiCabo VerdeCambodiaCameroonCanadaCaribbean small statesCentral African RepublicCentral Europe and the BalticsChadChileChinaColombiaComorosCongo, Dem. Rep.Congo, Rep.Costa RicaCote d'IvoireCroatiaCubaCyprusCzech RepublicDenmarkDjiboutiDominicaDominican RepublicEarly-demographic dividendEast Asia & PacificEast Asia & Pacific (excluding high income)East Asia & Pacific (IDA & IBRD countries)EcuadorEgypt, Arab Rep.El SalvadorEstoniaEthiopiaEuro areaEurope & Central AsiaEurope & Central Asia (excluding high income)Europe & Central Asia (IDA & IBRD countries)European UnionFijiFinlandFragile and conflict affected situationsFranceGabonGambia, TheGeorgiaGermanyGhanaGreeceGreenlandGrenadaGuatemalaGuineaGuinea-BissauGuyanaHaitiHeavily indebted poor countries (HIPC)High incomeHondurasHong Kong SAR, ChinaHungaryIBRD onlyIcelandIDA & IBRD totalIDA blendIDA onlyIDA totalIndiaIndonesiaIran, Islamic Rep.IraqIrelandIsraelItalyJamaicaJapanJordanKazakhstanKenyaKorea, Dem. People’s Rep.Korea, Rep.KosovoKuwaitKyrgyz RepublicLao PDRLate-demographic dividendLatin America & Caribbean Latin America & Caribbean (excluding high income)Latin America & the Caribbean (IDA & IBRD countries)LatviaLeast developed countries: UN classificationLebanonLiberiaLibyaLithuaniaLow & middle incomeLow incomeLower middle incomeLuxembourgMacao SAR, ChinaMacedonia, FYRMadagascarMalawiMalaysiaMaldivesMaliMaltaMauritaniaMauritiusMexicoMiddle East & North AfricaMiddle East & North Africa (excluding high income)Middle East & North Africa (IDA & IBRD countries)Middle incomeMoldovaMongoliaMontenegroMoroccoMozambiqueMyanmarNepalNetherlandsNew CaledoniaNew ZealandNicaraguaNigerNigeriaNorth AmericaNorwayOECD membersOmanOther small statesPacific island small statesPakistanPanamaPapua New GuineaParaguayPeruPhilippinesPolandPortugalPost-demographic dividendPre-demographic dividendQatarRomaniaRussian FederationRwandaSamoaSaudi ArabiaSenegalSerbiaSeychellesSierra LeoneSingaporeSlovak RepublicSloveniaSmall statesSomaliaSouth AfricaSouth AsiaSouth Asia (IDA & IBRD)SpainSri LankaSt. LuciaSt. Vincent and the GrenadinesSub-Saharan Africa Sub-Saharan Africa (excluding high income)Sub-Saharan Africa (IDA & IBRD countries)SudanSurinameSwedenSwitzerlandSyrian Arab RepublicTajikistanTanzaniaThailandTogoTrinidad and TobagoTunisiaTurkeyTurkmenistanUgandaUkraineUnited Arab EmiratesUnited KingdomUnited StatesUpper middle incomeUruguayUzbekistanVenezuela, RBVietnamWorldYemen, Rep.ZambiaZimbabwe Timeline:
This timeline shows a graph from 1987 to 2015 of Central African Republic. No data until 1986. Number of actual observations by date: 29.
Source name:
World Development Indicators
Source organization:
World Bank staff estimates based data from International Monetary Fund's Direction of Trade database.
Categories, topics:
Private Sector, Trade
Last updated:
apr 23, 2017
Indicators value changes by year
Maximum:
59.371
jan 1, 1991
At the date of observation
Value
Absolute change
Change from previous value
jan 1, 1987
0.481
+0.481
0.0%
jan 1, 1988
0.696
+0.215
44.76%
jan 1, 1989
0.639
-0.057
-8.15%
jan 1, 1990
1.303
+0.664
103.93%
jan 1, 1991
59.371
+58.068
4.46K%
jan 1, 1992
3.327
-56.043
-94.4%
jan 1, 1993
3.647
+0.319
9.59%
jan 1, 1994
2.41
-1.236
-33.91%
jan 1, 1995
0.366
-2.044
-84.82%
jan 1, 1996
0.279
-0.087
-23.81%
jan 1, 1997
0.131
-0.148
-53.09%
jan 1, 1998
0.292
+0.161
123.28%
jan 1, 1999
5.83
+5.538
1.9K%
jan 1, 2000
0.432
-5.398
-92.6%
jan 1, 2001
0.588
+0.157
36.37%
jan 1, 2002
1.133
+0.545
92.53%
jan 1, 2003
0.856
-0.277
-24.48%
jan 1, 2004
1.862
+1.006
117.59%
jan 1, 2005
1.671
-0.191
-10.26%
jan 1, 2006
2.756
+1.086
64.97%
jan 1, 2007
5.74
+2.983
108.24%
jan 1, 2008
11.803
+6.063
105.64%
jan 1, 2009
16.116
+4.313
36.54%
jan 1, 2010
15.043
-1.073
-6.66%
jan 1, 2011
12.336
-2.707
-18.0%
jan 1, 2012
10.091
-2.244
-18.19%
jan 1, 2013
6.108
-3.984
-39.48%
jan 1, 2014
10.001
+3.893
63.74%
jan 1, 2015
12.14
+2.139
21.39%
Ranking of countries by current statistics by years


Comments: