29
/
en
AIzaSyAYiBZKx7MnpbEhh9jyipgxe19OcubqV5w
April 1, 2024
53570
Other small states
OSS
false
2
1
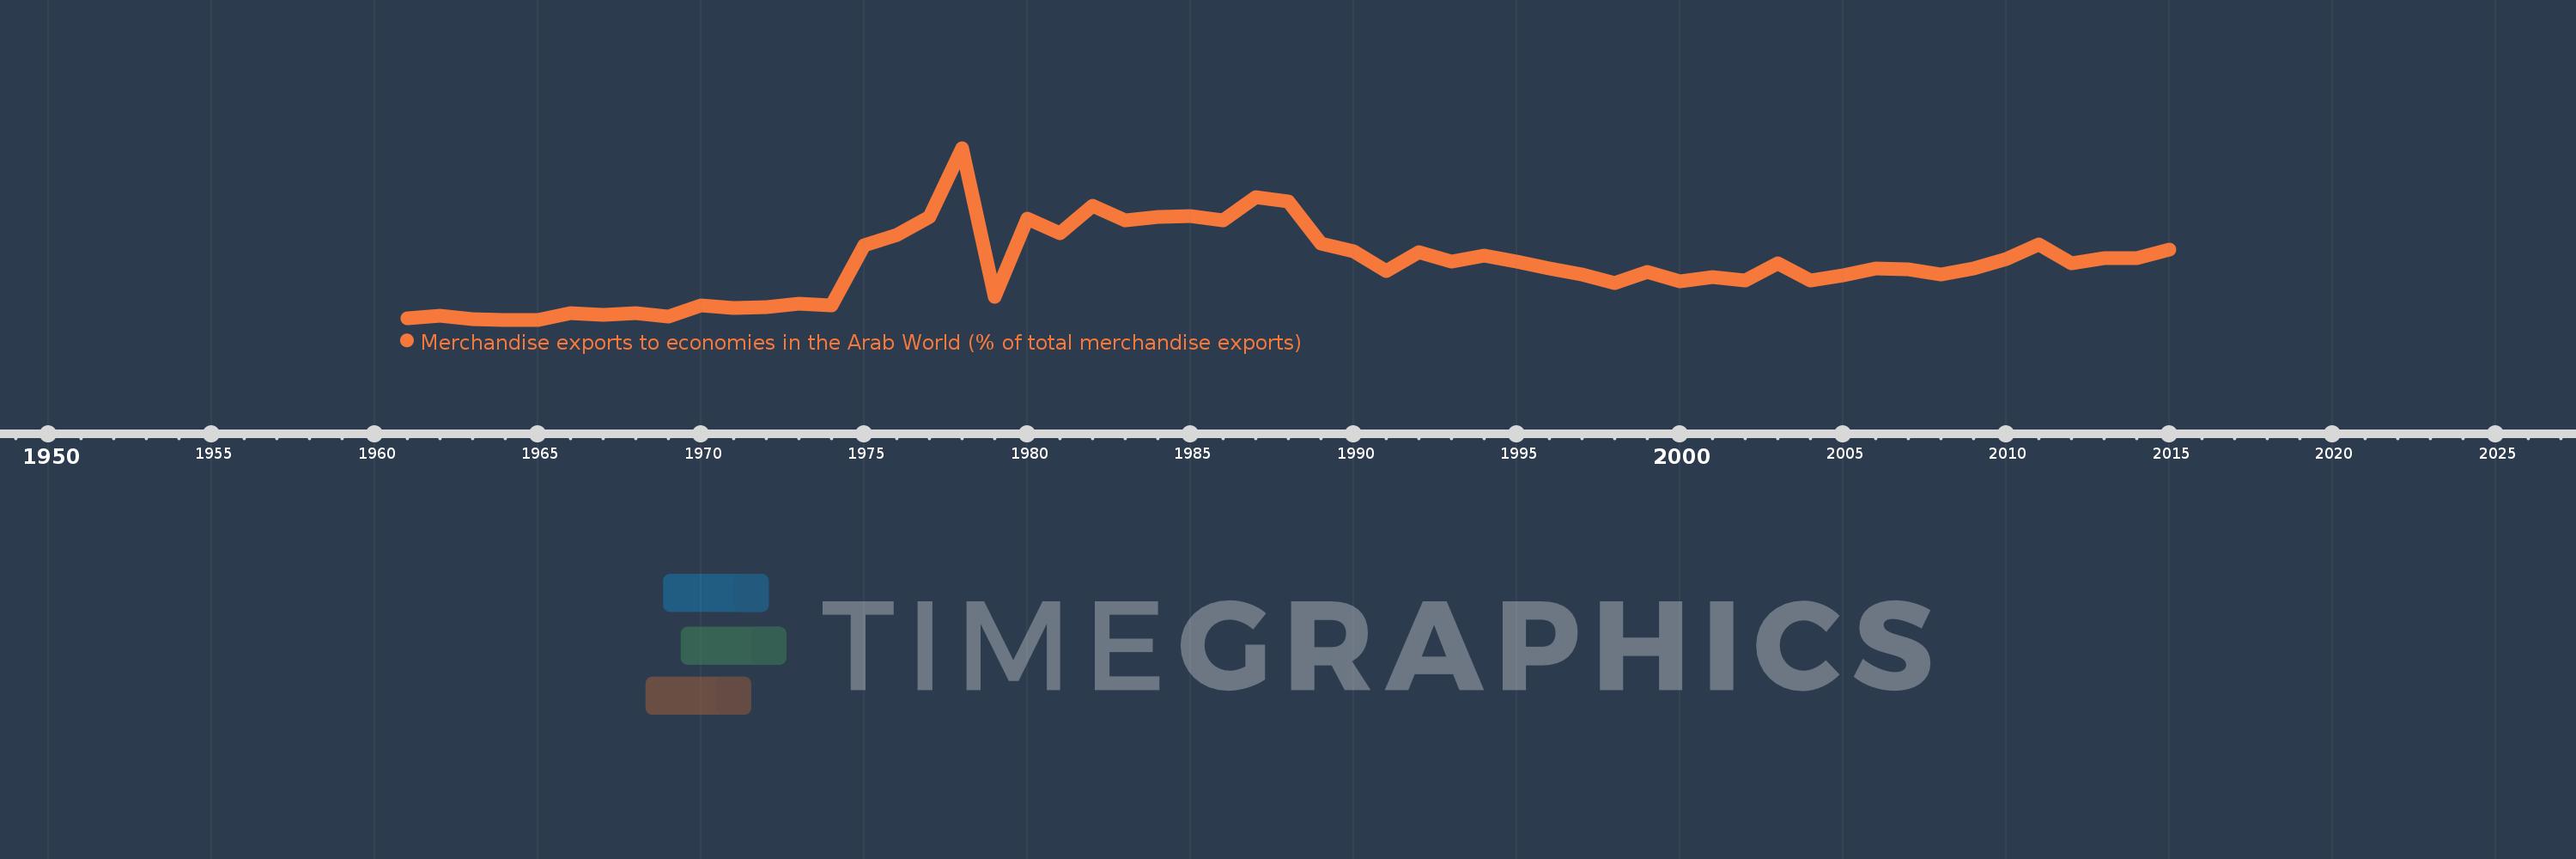
Merchandise exports to economies in the Arab World (% of total merchandise exports)
2015,2014,2013,2012,2011,2010,2009,2008,2007,2006,2005,2004,2003,2002,2001,2000,1999,1998,1997,1996,1995,1994,1993,1992,1991,1990,1989,1988,1987,1986,1985,1984,1983,1982,1981,1980,1979,1978,1977,1976,1975,1974,1973,1972,1971,1970,1969,1968,1967,1966,1965,1964,1963,1962,1961
This statistics in other country:
AfghanistanAlbaniaAlgeriaAngolaArab WorldArgentinaArmeniaArubaAustraliaAustriaAzerbaijanBahamas, TheBahrainBangladeshBarbadosBelarusBelgiumBelizeBeninBermudaBoliviaBosnia and HerzegovinaBrazilBrunei DarussalamBulgariaBurkina FasoBurundiCabo VerdeCambodiaCameroonCanadaCaribbean small statesCentral African RepublicCentral Europe and the BalticsChadChileChinaColombiaComorosCongo, Dem. Rep.Congo, Rep.Costa RicaCote d'IvoireCroatiaCubaCyprusCzech RepublicDenmarkDjiboutiDominicaDominican RepublicEarly-demographic dividendEast Asia & PacificEast Asia & Pacific (excluding high income)East Asia & Pacific (IDA & IBRD countries)EcuadorEgypt, Arab Rep.El SalvadorEstoniaEthiopiaEuro areaEurope & Central AsiaEurope & Central Asia (excluding high income)Europe & Central Asia (IDA & IBRD countries)European UnionFijiFinlandFragile and conflict affected situationsFranceGabonGambia, TheGeorgiaGermanyGhanaGreeceGreenlandGrenadaGuatemalaGuineaGuinea-BissauGuyanaHaitiHeavily indebted poor countries (HIPC)High incomeHondurasHong Kong SAR, ChinaHungaryIBRD onlyIcelandIDA & IBRD totalIDA blendIDA onlyIDA totalIndiaIndonesiaIran, Islamic Rep.IraqIrelandIsraelItalyJamaicaJapanJordanKazakhstanKenyaKorea, Dem. People’s Rep.Korea, Rep.KosovoKuwaitKyrgyz RepublicLao PDRLate-demographic dividendLatin America & Caribbean Latin America & Caribbean (excluding high income)Latin America & the Caribbean (IDA & IBRD countries)LatviaLeast developed countries: UN classificationLebanonLiberiaLibyaLithuaniaLow & middle incomeLow incomeLower middle incomeLuxembourgMacao SAR, ChinaMacedonia, FYRMadagascarMalawiMalaysiaMaldivesMaliMaltaMauritaniaMauritiusMexicoMiddle East & North AfricaMiddle East & North Africa (excluding high income)Middle East & North Africa (IDA & IBRD countries)Middle incomeMoldovaMongoliaMontenegroMoroccoMozambiqueMyanmarNepalNetherlandsNew CaledoniaNew ZealandNicaraguaNigerNigeriaNorth AmericaNorwayOECD membersOmanOther small statesPacific island small statesPakistanPanamaPapua New GuineaParaguayPeruPhilippinesPolandPortugalPost-demographic dividendPre-demographic dividendQatarRomaniaRussian FederationRwandaSamoaSaudi ArabiaSenegalSerbiaSeychellesSierra LeoneSingaporeSlovak RepublicSloveniaSmall statesSomaliaSouth AfricaSouth AsiaSouth Asia (IDA & IBRD)SpainSri LankaSt. LuciaSt. Vincent and the GrenadinesSub-Saharan Africa Sub-Saharan Africa (excluding high income)Sub-Saharan Africa (IDA & IBRD countries)SudanSurinameSwedenSwitzerlandSyrian Arab RepublicTajikistanTanzaniaThailandTogoTrinidad and TobagoTunisiaTurkeyTurkmenistanUgandaUkraineUnited Arab EmiratesUnited KingdomUnited StatesUpper middle incomeUruguayUzbekistanVenezuela, RBVietnamWorldYemen, Rep.ZambiaZimbabwe Timeline:
This timeline shows a graph from 1961 to 2015 of Other small states. No data until 1960. Number of actual observations by date: 55.
Source name:
World Development Indicators
Source organization:
World Bank staff estimates based data from International Monetary Fund's Direction of Trade database.
Categories, topics:
Private Sector, Trade
Last updated:
apr 23, 2017
Indicators value changes by year
Maximum:
14.298
jan 1, 1978
At the date of observation
Value
Absolute change
Change from previous value
jan 1, 1961
1.276
+1.276
0.0%
jan 1, 1962
1.448
+0.171
13.42%
jan 1, 1963
1.206
-0.242
-16.71%
jan 1, 1964
1.164
-0.042
-3.49%
jan 1, 1965
1.163
0.0
-0.02%
jan 1, 1966
1.696
+0.532
45.77%
jan 1, 1967
1.553
-0.143
-8.44%
jan 1, 1968
1.65
+0.097
6.27%
jan 1, 1969
1.397
-0.253
-15.31%
jan 1, 1970
2.285
+0.887
63.52%
jan 1, 1971
2.079
-0.205
-8.99%
jan 1, 1972
2.161
+0.082
3.93%
jan 1, 1973
2.368
+0.207
9.57%
jan 1, 1974
2.28
-0.088
-3.7%
jan 1, 1975
6.831
+4.55
199.55%
jan 1, 1976
7.62
+0.79
11.56%
jan 1, 1977
9.039
+1.418
18.61%
jan 1, 1978
14.298
+5.259
58.18%
jan 1, 1979
2.915
-11.383
-79.61%
jan 1, 1980
8.909
+5.994
205.64%
jan 1, 1981
7.767
-1.141
-12.81%
jan 1, 1982
9.901
+2.133
27.46%
jan 1, 1983
8.781
-1.12
-11.31%
jan 1, 1984
9.0
+0.22
2.5%
jan 1, 1985
9.089
+0.089
0.99%
jan 1, 1986
8.793
-0.296
-3.26%
jan 1, 1987
10.535
+1.742
19.81%
jan 1, 1988
10.178
-0.358
-3.4%
jan 1, 1989
7.001
-3.177
-31.22%
jan 1, 1990
6.367
-0.633
-9.05%
jan 1, 1991
4.918
-1.449
-22.76%
jan 1, 1992
6.337
+1.419
28.85%
jan 1, 1993
5.604
-0.733
-11.57%
jan 1, 1994
6.05
+0.446
7.97%
jan 1, 1995
5.611
-0.439
-7.25%
jan 1, 1996
5.058
-0.553
-9.86%
jan 1, 1997
4.642
-0.416
-8.23%
jan 1, 1998
3.937
-0.705
-15.19%
jan 1, 1999
4.791
+0.854
21.69%
jan 1, 2000
4.086
-0.705
-14.71%
jan 1, 2001
4.45
+0.364
8.92%
jan 1, 2002
4.153
-0.297
-6.67%
jan 1, 2003
5.509
+1.356
32.65%
jan 1, 2004
4.151
-1.359
-24.66%
jan 1, 2005
4.586
+0.435
10.48%
jan 1, 2006
5.104
+0.518
11.29%
jan 1, 2007
5.004
-0.1
-1.95%
jan 1, 2008
4.637
-0.367
-7.33%
jan 1, 2009
5.076
+0.438
9.45%
jan 1, 2010
5.827
+0.752
14.81%
jan 1, 2011
6.926
+1.099
18.85%
jan 1, 2012
5.501
-1.425
-20.58%
jan 1, 2013
5.882
+0.381
6.93%
jan 1, 2014
5.851
-0.031
-0.52%
jan 1, 2015
6.5
+0.649
11.09%
Ranking of countries by current statistics by years


Comments: