29
/
en
AIzaSyAYiBZKx7MnpbEhh9jyipgxe19OcubqV5w
April 1, 2024
269612
Turkey
TUR
true
2
1
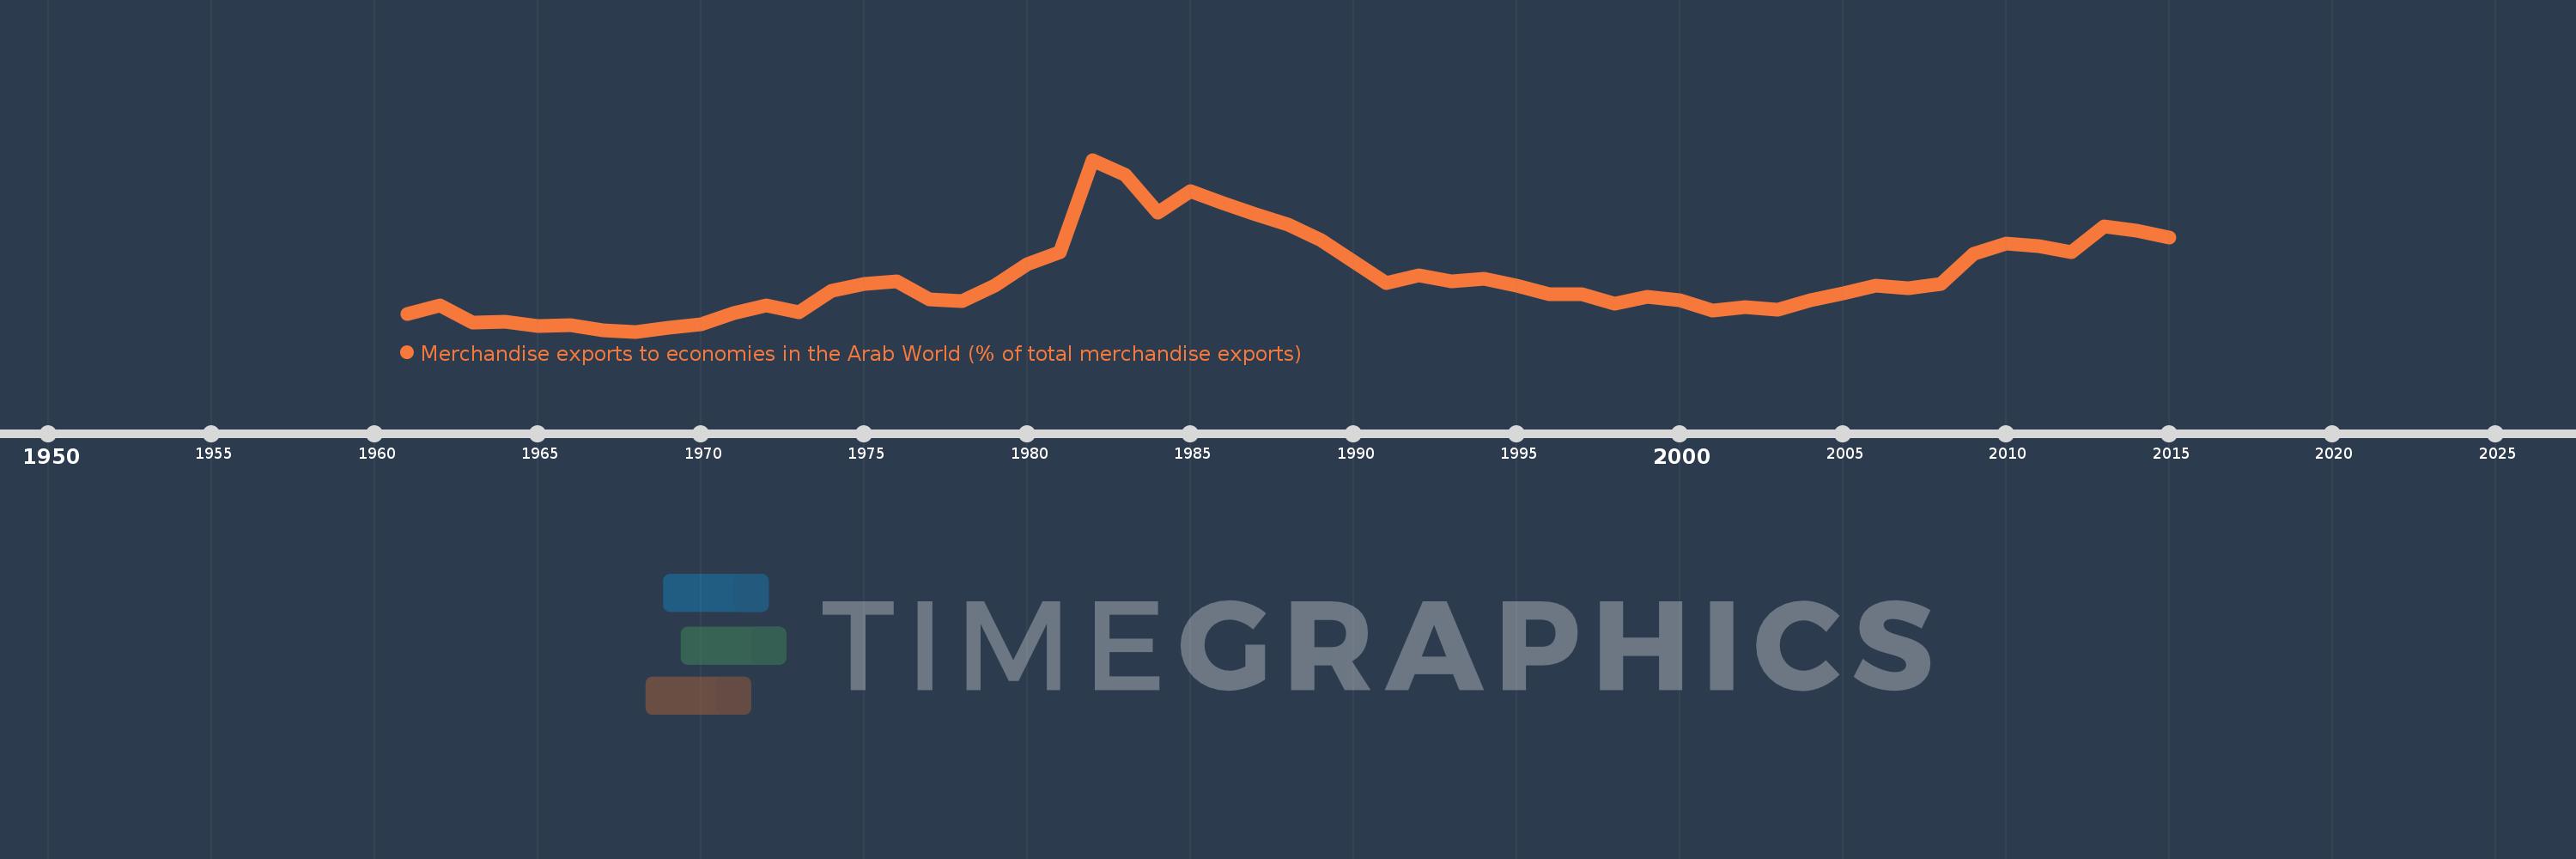
Merchandise exports to economies in the Arab World (% of total merchandise exports)
2015,2014,2013,2012,2011,2010,2009,2008,2007,2006,2005,2004,2003,2002,2001,2000,1999,1998,1997,1996,1995,1994,1993,1992,1991,1990,1989,1988,1987,1986,1985,1984,1983,1982,1981,1980,1979,1978,1977,1976,1975,1974,1973,1972,1971,1970,1969,1968,1967,1966,1965,1964,1963,1962,1961
This statistics in other country:
AfghanistanAlbaniaAlgeriaAngolaArab WorldArgentinaArmeniaArubaAustraliaAustriaAzerbaijanBahamas, TheBahrainBangladeshBarbadosBelarusBelgiumBelizeBeninBermudaBoliviaBosnia and HerzegovinaBrazilBrunei DarussalamBulgariaBurkina FasoBurundiCabo VerdeCambodiaCameroonCanadaCaribbean small statesCentral African RepublicCentral Europe and the BalticsChadChileChinaColombiaComorosCongo, Dem. Rep.Congo, Rep.Costa RicaCote d'IvoireCroatiaCubaCyprusCzech RepublicDenmarkDjiboutiDominicaDominican RepublicEarly-demographic dividendEast Asia & PacificEast Asia & Pacific (excluding high income)East Asia & Pacific (IDA & IBRD countries)EcuadorEgypt, Arab Rep.El SalvadorEstoniaEthiopiaEuro areaEurope & Central AsiaEurope & Central Asia (excluding high income)Europe & Central Asia (IDA & IBRD countries)European UnionFijiFinlandFragile and conflict affected situationsFranceGabonGambia, TheGeorgiaGermanyGhanaGreeceGreenlandGrenadaGuatemalaGuineaGuinea-BissauGuyanaHaitiHeavily indebted poor countries (HIPC)High incomeHondurasHong Kong SAR, ChinaHungaryIBRD onlyIcelandIDA & IBRD totalIDA blendIDA onlyIDA totalIndiaIndonesiaIran, Islamic Rep.IraqIrelandIsraelItalyJamaicaJapanJordanKazakhstanKenyaKorea, Dem. People’s Rep.Korea, Rep.KosovoKuwaitKyrgyz RepublicLao PDRLate-demographic dividendLatin America & Caribbean Latin America & Caribbean (excluding high income)Latin America & the Caribbean (IDA & IBRD countries)LatviaLeast developed countries: UN classificationLebanonLiberiaLibyaLithuaniaLow & middle incomeLow incomeLower middle incomeLuxembourgMacao SAR, ChinaMacedonia, FYRMadagascarMalawiMalaysiaMaldivesMaliMaltaMauritaniaMauritiusMexicoMiddle East & North AfricaMiddle East & North Africa (excluding high income)Middle East & North Africa (IDA & IBRD countries)Middle incomeMoldovaMongoliaMontenegroMoroccoMozambiqueMyanmarNepalNetherlandsNew CaledoniaNew ZealandNicaraguaNigerNigeriaNorth AmericaNorwayOECD membersOmanOther small statesPacific island small statesPakistanPanamaPapua New GuineaParaguayPeruPhilippinesPolandPortugalPost-demographic dividendPre-demographic dividendQatarRomaniaRussian FederationRwandaSamoaSaudi ArabiaSenegalSerbiaSeychellesSierra LeoneSingaporeSlovak RepublicSloveniaSmall statesSomaliaSouth AfricaSouth AsiaSouth Asia (IDA & IBRD)SpainSri LankaSt. LuciaSt. Vincent and the GrenadinesSub-Saharan Africa Sub-Saharan Africa (excluding high income)Sub-Saharan Africa (IDA & IBRD countries)SudanSurinameSwedenSwitzerlandSyrian Arab RepublicTajikistanTanzaniaThailandTogoTrinidad and TobagoTunisiaTurkeyTurkmenistanUgandaUkraineUnited Arab EmiratesUnited KingdomUnited StatesUpper middle incomeUruguayUzbekistanVenezuela, RBVietnamWorldYemen, Rep.ZambiaZimbabwe Timeline:
This timeline shows a graph from 1961 to 2015 of Turkey. No data until 1960. Number of actual observations by date: 55.
Source name:
World Development Indicators
Source organization:
World Bank staff estimates based data from International Monetary Fund's Direction of Trade database.
Categories, topics:
Private Sector, Trade
Last updated:
apr 23, 2017
Indicators value changes by year
Maximum:
35.779
jan 1, 1982
At the date of observation
Value
Absolute change
Change from previous value
jan 1, 1961
8.213
+8.213
0.0%
jan 1, 1962
9.741
+1.527
18.6%
jan 1, 1963
6.695
-3.046
-31.27%
jan 1, 1964
6.795
+0.101
1.5%
jan 1, 1965
6.011
-0.784
-11.54%
jan 1, 1966
6.253
+0.242
4.02%
jan 1, 1967
5.3
-0.953
-15.24%
jan 1, 1968
5.072
-0.228
-4.3%
jan 1, 1969
5.828
+0.756
14.91%
jan 1, 1970
6.323
+0.495
8.49%
jan 1, 1971
8.398
+2.075
32.82%
jan 1, 1972
9.75
+1.352
16.1%
jan 1, 1973
8.572
-1.177
-12.08%
jan 1, 1974
12.297
+3.724
43.45%
jan 1, 1975
13.561
+1.264
10.28%
jan 1, 1976
14.095
+0.534
3.94%
jan 1, 1977
10.837
-3.258
-23.12%
jan 1, 1978
10.536
-0.301
-2.78%
jan 1, 1979
13.27
+2.734
25.95%
jan 1, 1980
17.09
+3.82
28.79%
jan 1, 1981
19.234
+2.143
12.54%
jan 1, 1982
35.779
+16.545
86.02%
jan 1, 1983
33.08
-2.698
-7.54%
jan 1, 1984
26.363
-6.717
-20.3%
jan 1, 1985
30.165
+3.801
14.42%
jan 1, 1986
28.002
-2.163
-7.17%
jan 1, 1987
25.975
-2.027
-7.24%
jan 1, 1988
24.195
-1.78
-6.85%
jan 1, 1989
21.485
-2.71
-11.2%
jan 1, 1990
17.612
-3.873
-18.03%
jan 1, 1991
13.675
-3.937
-22.35%
jan 1, 1992
15.084
+1.409
10.3%
jan 1, 1993
14.019
-1.065
-7.06%
jan 1, 1994
14.479
+0.46
3.28%
jan 1, 1995
13.236
-1.243
-8.58%
jan 1, 1996
11.749
-1.488
-11.24%
jan 1, 1997
11.703
-0.046
-0.39%
jan 1, 1998
10.037
-1.665
-14.23%
jan 1, 1999
11.255
+1.218
12.13%
jan 1, 2000
10.691
-0.564
-5.01%
jan 1, 2001
8.836
-1.854
-17.35%
jan 1, 2002
9.388
+0.552
6.25%
jan 1, 2003
9.013
-0.375
-3.99%
jan 1, 2004
10.635
+1.622
17.99%
jan 1, 2005
11.87
+1.235
11.61%
jan 1, 2006
13.218
+1.348
11.36%
jan 1, 2007
12.823
-0.395
-2.99%
jan 1, 2008
13.555
+0.732
5.71%
jan 1, 2009
18.899
+5.345
39.43%
jan 1, 2010
20.808
+1.908
10.1%
jan 1, 2011
20.354
-0.454
-2.18%
jan 1, 2012
19.212
-1.142
-5.61%
jan 1, 2013
23.831
+4.62
24.05%
jan 1, 2014
23.103
-0.729
-3.06%
jan 1, 2015
21.899
-1.204
-5.21%
Ranking of countries by current statistics by years


Comments: