29
/
en
AIzaSyAYiBZKx7MnpbEhh9jyipgxe19OcubqV5w
April 1, 2024
135783
Gabon
GAB
true
2
1
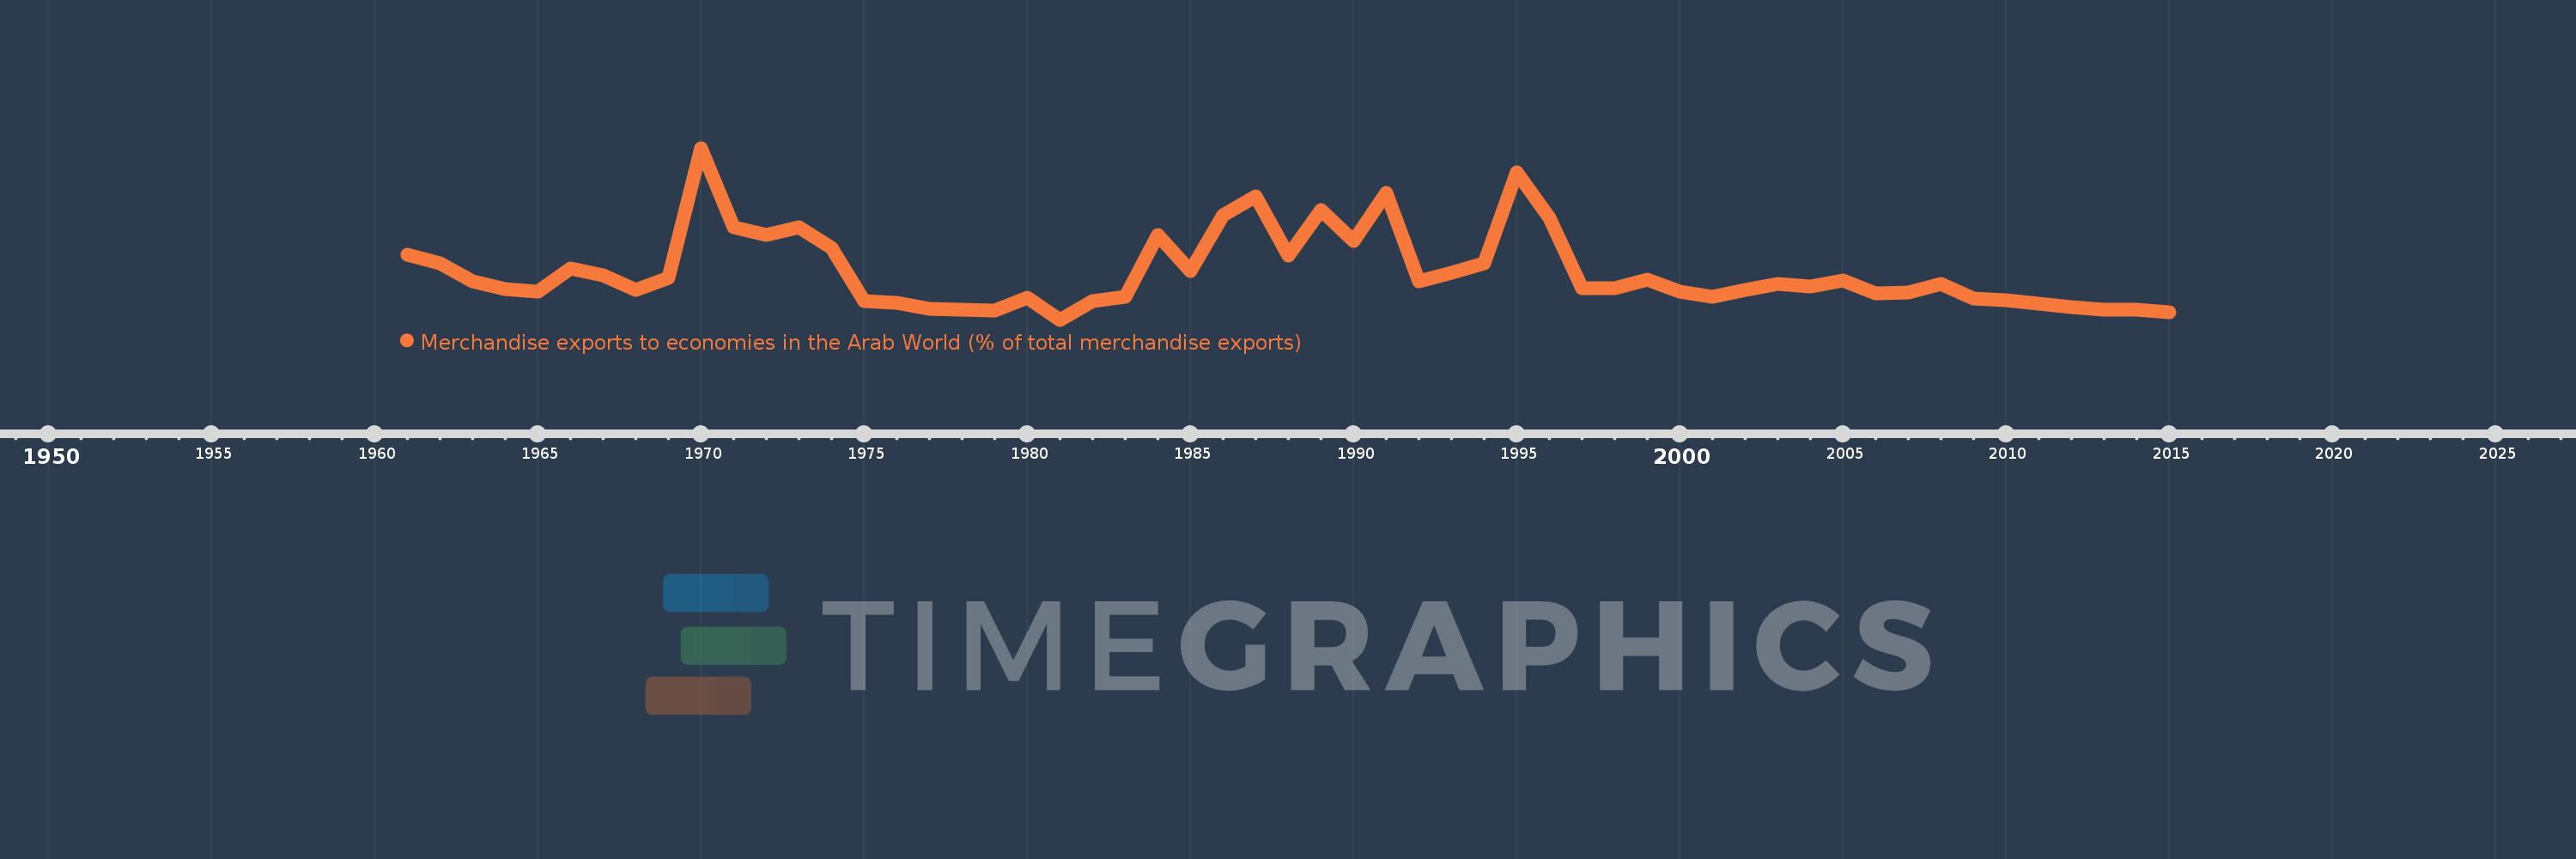
Merchandise exports to economies in the Arab World (% of total merchandise exports)
2015,2014,2013,2012,2011,2010,2009,2008,2007,2006,2005,2004,2003,2002,2001,2000,1999,1998,1997,1996,1995,1994,1993,1992,1991,1990,1989,1988,1987,1986,1985,1984,1983,1982,1981,1980,1979,1978,1977,1976,1975,1974,1973,1972,1971,1970,1969,1968,1967,1966,1965,1964,1963,1962,1961
This statistics in other country:
AfghanistanAlbaniaAlgeriaAngolaArab WorldArgentinaArmeniaArubaAustraliaAustriaAzerbaijanBahamas, TheBahrainBangladeshBarbadosBelarusBelgiumBelizeBeninBermudaBoliviaBosnia and HerzegovinaBrazilBrunei DarussalamBulgariaBurkina FasoBurundiCabo VerdeCambodiaCameroonCanadaCaribbean small statesCentral African RepublicCentral Europe and the BalticsChadChileChinaColombiaComorosCongo, Dem. Rep.Congo, Rep.Costa RicaCote d'IvoireCroatiaCubaCyprusCzech RepublicDenmarkDjiboutiDominicaDominican RepublicEarly-demographic dividendEast Asia & PacificEast Asia & Pacific (excluding high income)East Asia & Pacific (IDA & IBRD countries)EcuadorEgypt, Arab Rep.El SalvadorEstoniaEthiopiaEuro areaEurope & Central AsiaEurope & Central Asia (excluding high income)Europe & Central Asia (IDA & IBRD countries)European UnionFijiFinlandFragile and conflict affected situationsFranceGabonGambia, TheGeorgiaGermanyGhanaGreeceGreenlandGrenadaGuatemalaGuineaGuinea-BissauGuyanaHaitiHeavily indebted poor countries (HIPC)High incomeHondurasHong Kong SAR, ChinaHungaryIBRD onlyIcelandIDA & IBRD totalIDA blendIDA onlyIDA totalIndiaIndonesiaIran, Islamic Rep.IraqIrelandIsraelItalyJamaicaJapanJordanKazakhstanKenyaKorea, Dem. People’s Rep.Korea, Rep.KosovoKuwaitKyrgyz RepublicLao PDRLate-demographic dividendLatin America & Caribbean Latin America & Caribbean (excluding high income)Latin America & the Caribbean (IDA & IBRD countries)LatviaLeast developed countries: UN classificationLebanonLiberiaLibyaLithuaniaLow & middle incomeLow incomeLower middle incomeLuxembourgMacao SAR, ChinaMacedonia, FYRMadagascarMalawiMalaysiaMaldivesMaliMaltaMauritaniaMauritiusMexicoMiddle East & North AfricaMiddle East & North Africa (excluding high income)Middle East & North Africa (IDA & IBRD countries)Middle incomeMoldovaMongoliaMontenegroMoroccoMozambiqueMyanmarNepalNetherlandsNew CaledoniaNew ZealandNicaraguaNigerNigeriaNorth AmericaNorwayOECD membersOmanOther small statesPacific island small statesPakistanPanamaPapua New GuineaParaguayPeruPhilippinesPolandPortugalPost-demographic dividendPre-demographic dividendQatarRomaniaRussian FederationRwandaSamoaSaudi ArabiaSenegalSerbiaSeychellesSierra LeoneSingaporeSlovak RepublicSloveniaSmall statesSomaliaSouth AfricaSouth AsiaSouth Asia (IDA & IBRD)SpainSri LankaSt. LuciaSt. Vincent and the GrenadinesSub-Saharan Africa Sub-Saharan Africa (excluding high income)Sub-Saharan Africa (IDA & IBRD countries)SudanSurinameSwedenSwitzerlandSyrian Arab RepublicTajikistanTanzaniaThailandTogoTrinidad and TobagoTunisiaTurkeyTurkmenistanUgandaUkraineUnited Arab EmiratesUnited KingdomUnited StatesUpper middle incomeUruguayUzbekistanVenezuela, RBVietnamWorldYemen, Rep.ZambiaZimbabwe Timeline:
This timeline shows a graph from 1961 to 2015 of Gabon. No data until 1960. Number of actual observations by date: 55.
Source name:
World Development Indicators
Source organization:
World Bank staff estimates based data from International Monetary Fund's Direction of Trade database.
Categories, topics:
Private Sector, Trade
Last updated:
apr 23, 2017
Indicators value changes by year
At the date of observation
Value
Absolute change
Change from previous value
jan 1, 1961
1.464
+1.464
0.0%
jan 1, 1962
1.268
-0.196
-13.41%
jan 1, 1963
0.853
-0.415
-32.72%
jan 1, 1964
0.681
-0.172
-20.16%
jan 1, 1965
0.634
-0.048
-6.99%
jan 1, 1966
1.143
+0.509
80.38%
jan 1, 1967
0.993
-0.15
-13.11%
jan 1, 1968
0.667
-0.326
-32.81%
jan 1, 1969
0.946
+0.279
41.84%
jan 1, 1970
3.856
+2.91
307.48%
jan 1, 1971
2.067
-1.789
-46.4%
jan 1, 1972
1.91
-0.157
-7.61%
jan 1, 1973
2.074
+0.164
8.61%
jan 1, 1974
1.61
-0.464
-22.38%
jan 1, 1975
0.426
-1.184
-73.52%
jan 1, 1976
0.38
-0.047
-10.98%
jan 1, 1977
0.247
-0.133
-35.03%
jan 1, 1978
0.226
-0.02
-8.18%
jan 1, 1979
0.214
-0.013
-5.55%
jan 1, 1980
0.49
+0.276
129.0%
jan 1, 1981
0.0
-0.49
-100.0%
jan 1, 1982
0.422
+0.422
%
jan 1, 1983
0.509
+0.087
20.62%
jan 1, 1984
1.903
+1.394
274.07%
jan 1, 1985
1.085
-0.818
-42.98%
jan 1, 1986
2.344
+1.258
115.95%
jan 1, 1987
2.777
+0.433
18.47%
jan 1, 1988
1.432
-1.344
-48.42%
jan 1, 1989
2.465
+1.033
72.11%
jan 1, 1990
1.762
-0.703
-28.53%
jan 1, 1991
2.839
+1.077
61.12%
jan 1, 1992
0.862
-1.976
-69.62%
jan 1, 1993
1.058
+0.196
22.75%
jan 1, 1994
1.268
+0.209
19.77%
jan 1, 1995
3.311
+2.043
161.21%
jan 1, 1996
2.298
-1.013
-30.59%
jan 1, 1997
0.701
-1.597
-69.48%
jan 1, 1998
0.704
+0.002
0.31%
jan 1, 1999
0.897
+0.194
27.5%
jan 1, 2000
0.64
-0.257
-28.68%
jan 1, 2001
0.508
-0.132
-20.66%
jan 1, 2002
0.678
+0.17
33.48%
jan 1, 2003
0.799
+0.121
17.91%
jan 1, 2004
0.743
-0.056
-6.95%
jan 1, 2005
0.874
+0.13
17.55%
jan 1, 2006
0.585
-0.289
-33.1%
jan 1, 2007
0.618
+0.034
5.79%
jan 1, 2008
0.803
+0.184
29.83%
jan 1, 2009
0.477
-0.326
-40.65%
jan 1, 2010
0.43
-0.047
-9.81%
jan 1, 2011
0.355
-0.074
-17.29%
jan 1, 2012
0.277
-0.078
-22.03%
jan 1, 2013
0.224
-0.053
-19.25%
jan 1, 2014
0.231
+0.007
3.19%
jan 1, 2015
0.173
-0.058
-25.09%
Ranking of countries by current statistics by years


Comments: