29
/
en
AIzaSyAYiBZKx7MnpbEhh9jyipgxe19OcubqV5w
April 1, 2024
215519
Oman
OMN
true
2
1
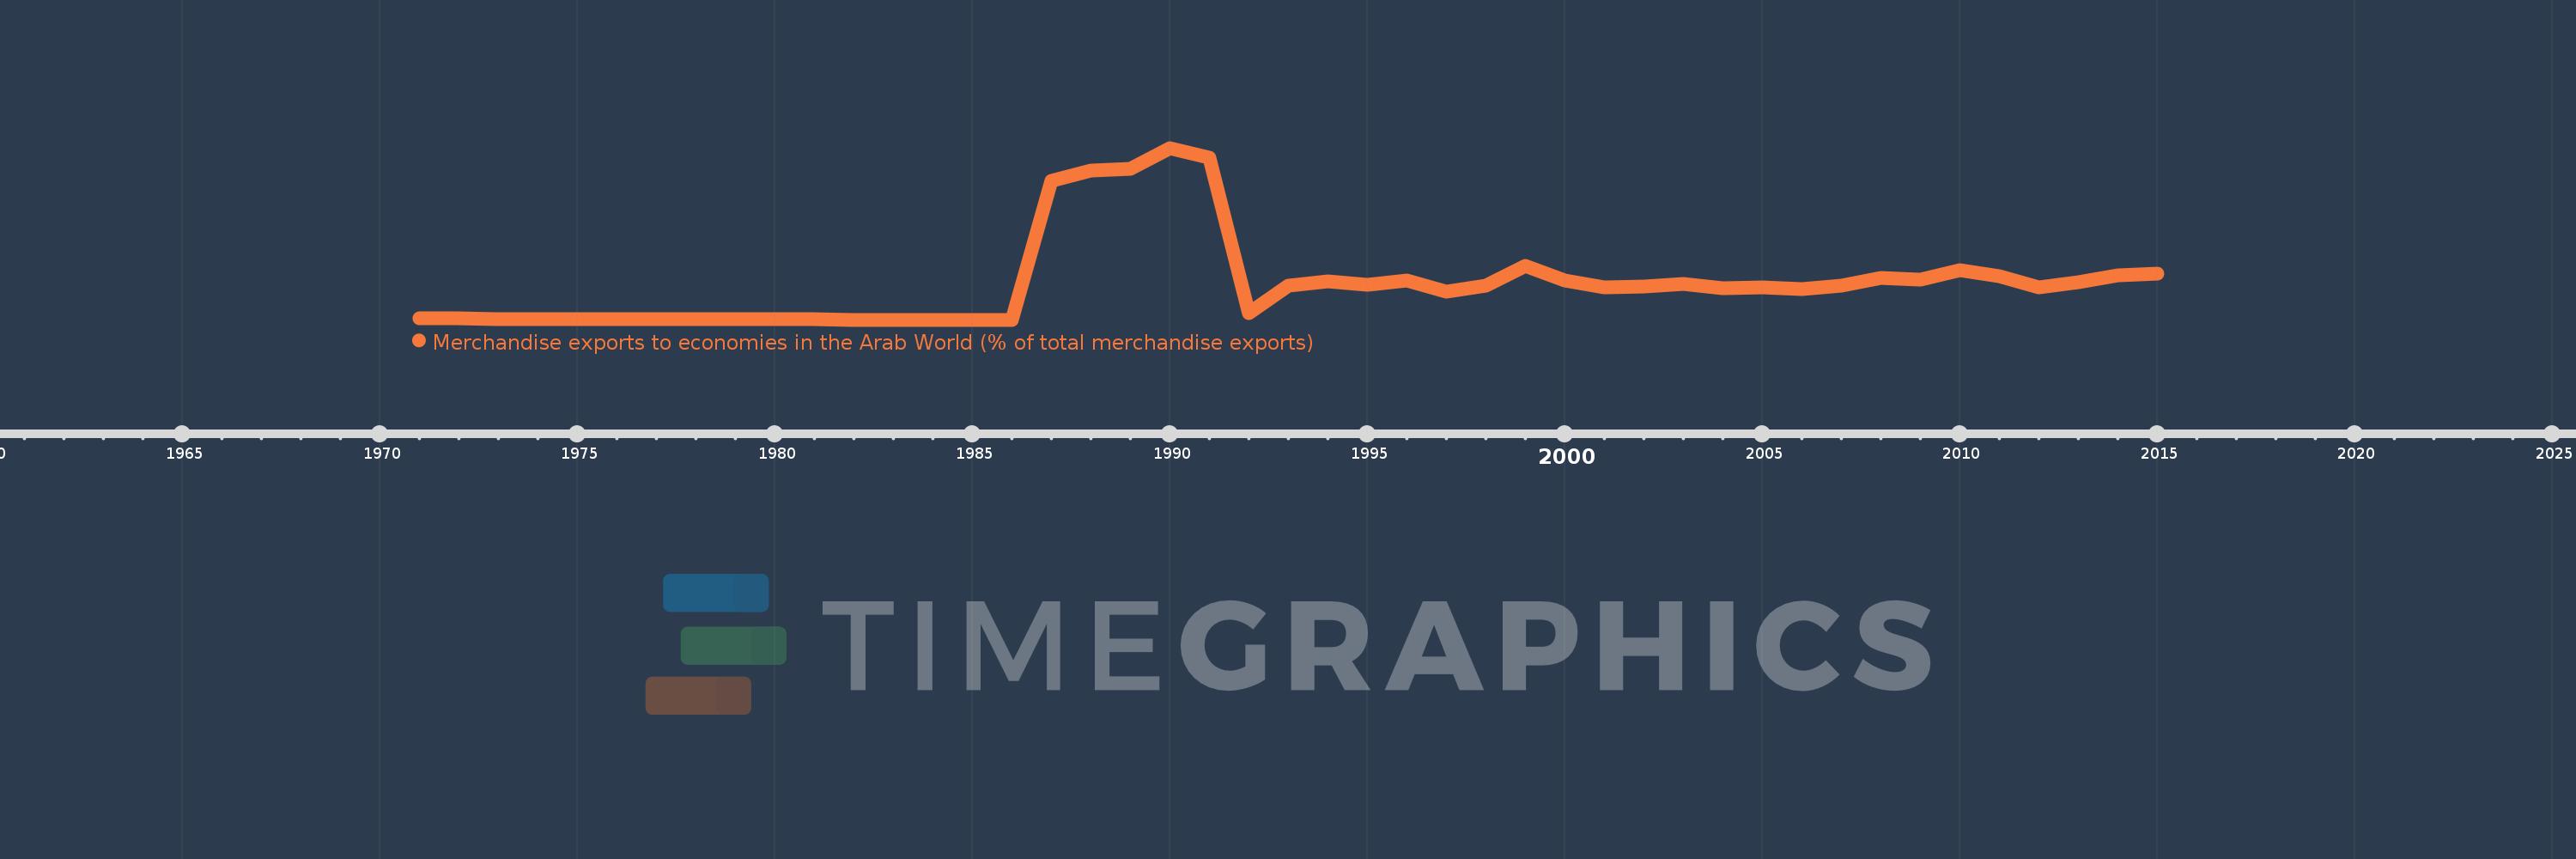
Merchandise exports to economies in the Arab World (% of total merchandise exports)
2015,2014,2013,2012,2011,2010,2009,2008,2007,2006,2005,2004,2003,2002,2001,2000,1999,1998,1997,1996,1995,1994,1993,1992,1991,1990,1989,1988,1987,1986,1985,1984,1983,1982,1981,1980,1979,1978,1977,1976,1975,1974,1973,1972,1971
This statistics in other country:
AfghanistanAlbaniaAlgeriaAngolaArab WorldArgentinaArmeniaArubaAustraliaAustriaAzerbaijanBahamas, TheBahrainBangladeshBarbadosBelarusBelgiumBelizeBeninBermudaBoliviaBosnia and HerzegovinaBrazilBrunei DarussalamBulgariaBurkina FasoBurundiCabo VerdeCambodiaCameroonCanadaCaribbean small statesCentral African RepublicCentral Europe and the BalticsChadChileChinaColombiaComorosCongo, Dem. Rep.Congo, Rep.Costa RicaCote d'IvoireCroatiaCubaCyprusCzech RepublicDenmarkDjiboutiDominicaDominican RepublicEarly-demographic dividendEast Asia & PacificEast Asia & Pacific (excluding high income)East Asia & Pacific (IDA & IBRD countries)EcuadorEgypt, Arab Rep.El SalvadorEstoniaEthiopiaEuro areaEurope & Central AsiaEurope & Central Asia (excluding high income)Europe & Central Asia (IDA & IBRD countries)European UnionFijiFinlandFragile and conflict affected situationsFranceGabonGambia, TheGeorgiaGermanyGhanaGreeceGreenlandGrenadaGuatemalaGuineaGuinea-BissauGuyanaHaitiHeavily indebted poor countries (HIPC)High incomeHondurasHong Kong SAR, ChinaHungaryIBRD onlyIcelandIDA & IBRD totalIDA blendIDA onlyIDA totalIndiaIndonesiaIran, Islamic Rep.IraqIrelandIsraelItalyJamaicaJapanJordanKazakhstanKenyaKorea, Dem. People’s Rep.Korea, Rep.KosovoKuwaitKyrgyz RepublicLao PDRLate-demographic dividendLatin America & Caribbean Latin America & Caribbean (excluding high income)Latin America & the Caribbean (IDA & IBRD countries)LatviaLeast developed countries: UN classificationLebanonLiberiaLibyaLithuaniaLow & middle incomeLow incomeLower middle incomeLuxembourgMacao SAR, ChinaMacedonia, FYRMadagascarMalawiMalaysiaMaldivesMaliMaltaMauritaniaMauritiusMexicoMiddle East & North AfricaMiddle East & North Africa (excluding high income)Middle East & North Africa (IDA & IBRD countries)Middle incomeMoldovaMongoliaMontenegroMoroccoMozambiqueMyanmarNepalNetherlandsNew CaledoniaNew ZealandNicaraguaNigerNigeriaNorth AmericaNorwayOECD membersOmanOther small statesPacific island small statesPakistanPanamaPapua New GuineaParaguayPeruPhilippinesPolandPortugalPost-demographic dividendPre-demographic dividendQatarRomaniaRussian FederationRwandaSamoaSaudi ArabiaSenegalSerbiaSeychellesSierra LeoneSingaporeSlovak RepublicSloveniaSmall statesSomaliaSouth AfricaSouth AsiaSouth Asia (IDA & IBRD)SpainSri LankaSt. LuciaSt. Vincent and the GrenadinesSub-Saharan Africa Sub-Saharan Africa (excluding high income)Sub-Saharan Africa (IDA & IBRD countries)SudanSurinameSwedenSwitzerlandSyrian Arab RepublicTajikistanTanzaniaThailandTogoTrinidad and TobagoTunisiaTurkeyTurkmenistanUgandaUkraineUnited Arab EmiratesUnited KingdomUnited StatesUpper middle incomeUruguayUzbekistanVenezuela, RBVietnamWorldYemen, Rep.ZambiaZimbabwe Timeline:
This timeline shows a graph from 1971 to 2015 of Oman. No data until 1970. Number of actual observations by date: 45.
Source name:
World Development Indicators
Source organization:
World Bank staff estimates based data from International Monetary Fund's Direction of Trade database.
Categories, topics:
Private Sector, Trade
Last updated:
apr 23, 2017
Indicators value changes by year
Maximum:
65.937
jan 1, 1990
At the date of observation
Value
Absolute change
Change from previous value
jan 1, 1971
0.471
+0.471
0.0%
jan 1, 1972
0.411
-0.059
-12.6%
jan 1, 1973
0.251
-0.16
-39.0%
jan 1, 1974
0.385
+0.134
53.37%
jan 1, 1975
0.081
-0.304
-78.99%
jan 1, 1976
0.201
+0.121
149.05%
jan 1, 1977
0.242
+0.041
20.13%
jan 1, 1978
0.207
-0.035
-14.43%
jan 1, 1979
0.377
+0.17
82.06%
jan 1, 1980
0.341
-0.036
-9.58%
jan 1, 1981
0.312
-0.028
-8.34%
jan 1, 1982
0.0
-0.312
-100.0%
jan 1, 1987
53.158
+53.158
%
jan 1, 1988
57.141
+3.983
7.49%
jan 1, 1989
57.927
+0.786
1.38%
jan 1, 1990
65.937
+8.01
13.83%
jan 1, 1991
62.222
-3.715
-5.63%
jan 1, 1992
2.434
-59.789
-96.09%
jan 1, 1993
13.227
+10.793
443.49%
jan 1, 1994
14.708
+1.481
11.2%
jan 1, 1995
13.465
-1.243
-8.45%
jan 1, 1996
15.202
+1.738
12.9%
jan 1, 1997
10.905
-4.297
-28.27%
jan 1, 1998
13.074
+2.168
19.88%
jan 1, 1999
20.644
+7.571
57.91%
jan 1, 2000
15.128
-5.516
-26.72%
jan 1, 2001
12.486
-2.643
-17.47%
jan 1, 2002
12.779
+0.293
2.35%
jan 1, 2003
13.76
+0.981
7.67%
jan 1, 2004
12.086
-1.674
-12.17%
jan 1, 2005
12.433
+0.347
2.87%
jan 1, 2006
11.648
-0.786
-6.32%
jan 1, 2007
13.201
+1.554
13.34%
jan 1, 2008
16.05
+2.849
21.58%
jan 1, 2009
15.422
-0.628
-3.91%
jan 1, 2010
19.02
+3.598
23.33%
jan 1, 2011
16.709
-2.311
-12.15%
jan 1, 2012
12.309
-4.401
-26.34%
jan 1, 2013
14.303
+1.994
16.2%
jan 1, 2014
17.036
+2.734
19.11%
jan 1, 2015
17.863
+0.827
4.85%
Ranking of countries by current statistics by years


Comments: