29
/
en
AIzaSyAYiBZKx7MnpbEhh9jyipgxe19OcubqV5w
April 1, 2024
26715
Early-demographic dividend
EAR
false
2
1
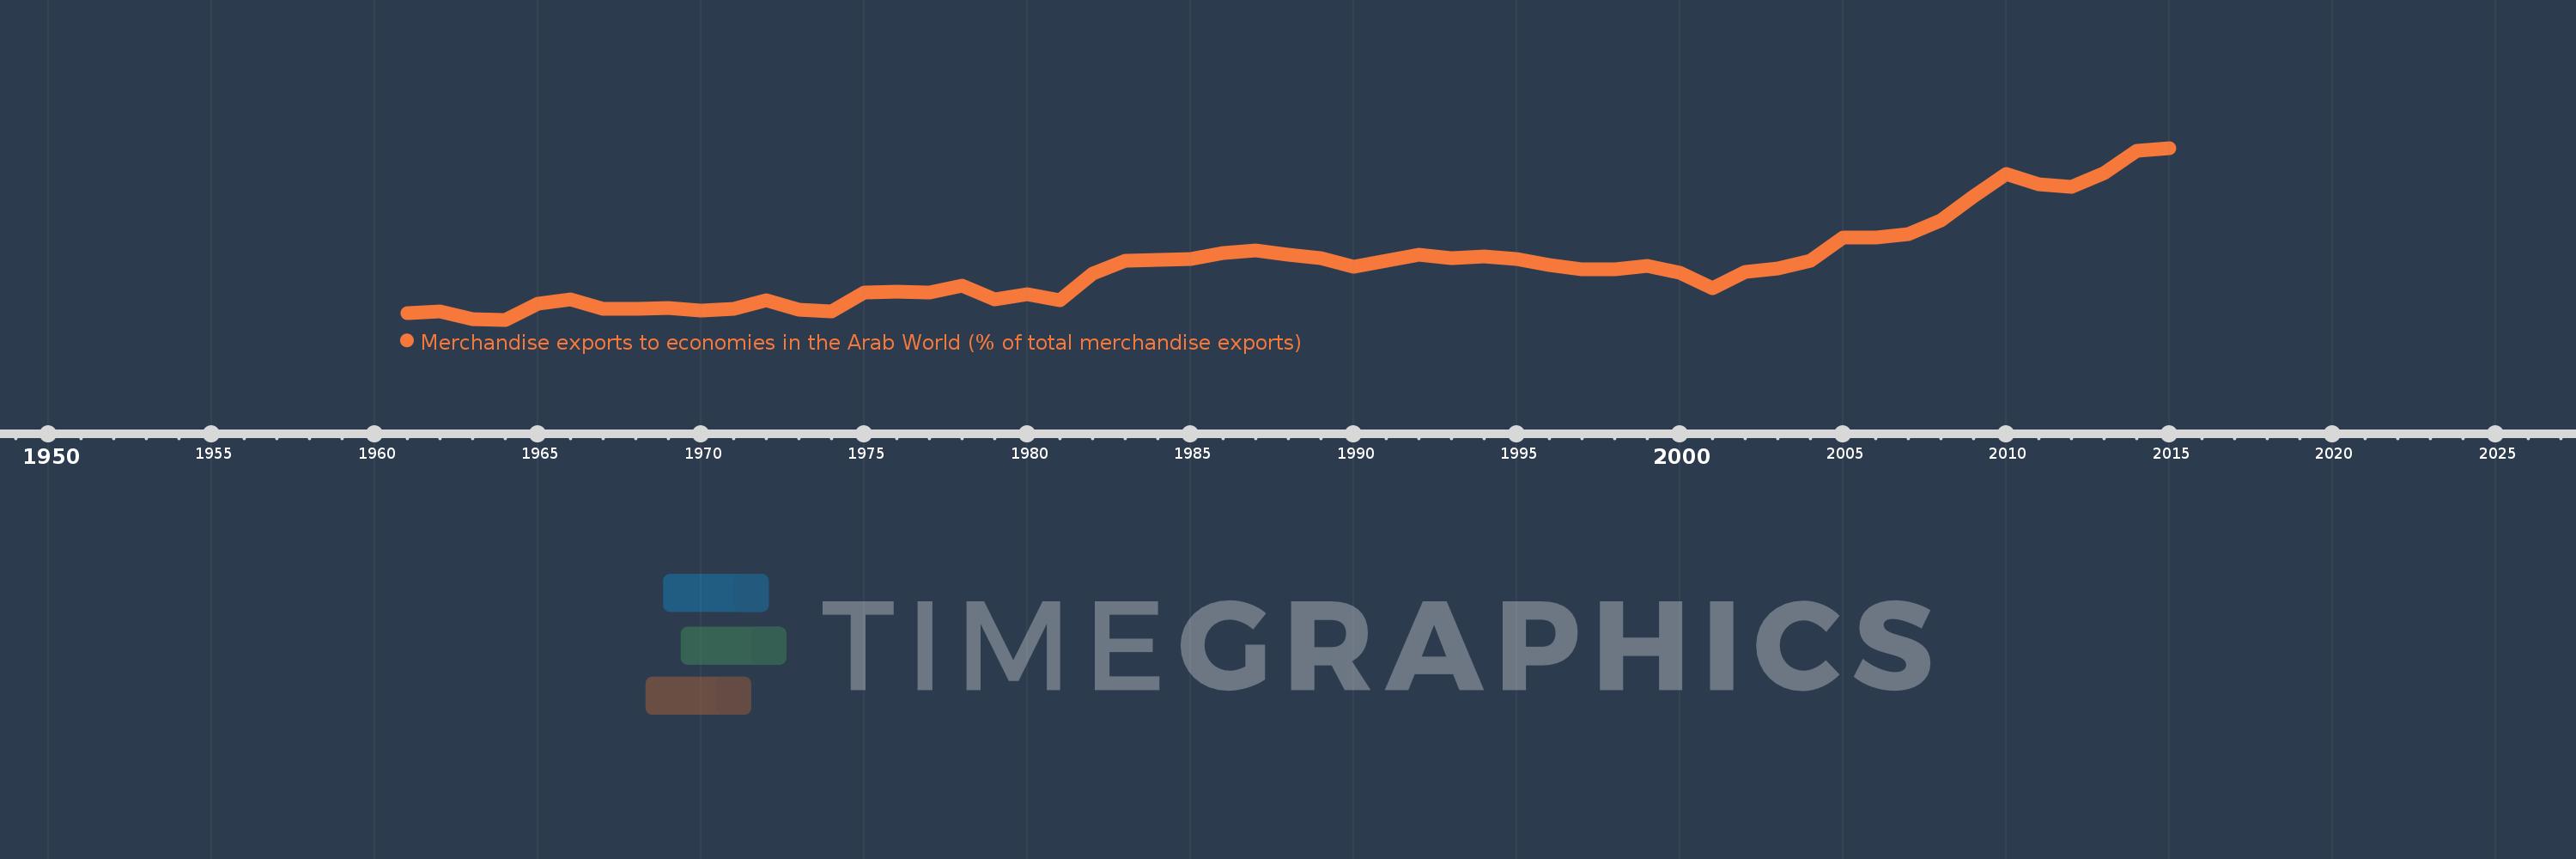
Merchandise exports to economies in the Arab World (% of total merchandise exports)
2015,2014,2013,2012,2011,2010,2009,2008,2007,2006,2005,2004,2003,2002,2001,2000,1999,1998,1997,1996,1995,1994,1993,1992,1991,1990,1989,1988,1987,1986,1985,1984,1983,1982,1981,1980,1979,1978,1977,1976,1975,1974,1973,1972,1971,1970,1969,1968,1967,1966,1965,1964,1963,1962,1961
This statistics in other country:
AfghanistanAlbaniaAlgeriaAngolaArab WorldArgentinaArmeniaArubaAustraliaAustriaAzerbaijanBahamas, TheBahrainBangladeshBarbadosBelarusBelgiumBelizeBeninBermudaBoliviaBosnia and HerzegovinaBrazilBrunei DarussalamBulgariaBurkina FasoBurundiCabo VerdeCambodiaCameroonCanadaCaribbean small statesCentral African RepublicCentral Europe and the BalticsChadChileChinaColombiaComorosCongo, Dem. Rep.Congo, Rep.Costa RicaCote d'IvoireCroatiaCubaCyprusCzech RepublicDenmarkDjiboutiDominicaDominican RepublicEarly-demographic dividendEast Asia & PacificEast Asia & Pacific (excluding high income)East Asia & Pacific (IDA & IBRD countries)EcuadorEgypt, Arab Rep.El SalvadorEstoniaEthiopiaEuro areaEurope & Central AsiaEurope & Central Asia (excluding high income)Europe & Central Asia (IDA & IBRD countries)European UnionFijiFinlandFragile and conflict affected situationsFranceGabonGambia, TheGeorgiaGermanyGhanaGreeceGreenlandGrenadaGuatemalaGuineaGuinea-BissauGuyanaHaitiHeavily indebted poor countries (HIPC)High incomeHondurasHong Kong SAR, ChinaHungaryIBRD onlyIcelandIDA & IBRD totalIDA blendIDA onlyIDA totalIndiaIndonesiaIran, Islamic Rep.IraqIrelandIsraelItalyJamaicaJapanJordanKazakhstanKenyaKorea, Dem. People’s Rep.Korea, Rep.KosovoKuwaitKyrgyz RepublicLao PDRLate-demographic dividendLatin America & Caribbean Latin America & Caribbean (excluding high income)Latin America & the Caribbean (IDA & IBRD countries)LatviaLeast developed countries: UN classificationLebanonLiberiaLibyaLithuaniaLow & middle incomeLow incomeLower middle incomeLuxembourgMacao SAR, ChinaMacedonia, FYRMadagascarMalawiMalaysiaMaldivesMaliMaltaMauritaniaMauritiusMexicoMiddle East & North AfricaMiddle East & North Africa (excluding high income)Middle East & North Africa (IDA & IBRD countries)Middle incomeMoldovaMongoliaMontenegroMoroccoMozambiqueMyanmarNepalNetherlandsNew CaledoniaNew ZealandNicaraguaNigerNigeriaNorth AmericaNorwayOECD membersOmanOther small statesPacific island small statesPakistanPanamaPapua New GuineaParaguayPeruPhilippinesPolandPortugalPost-demographic dividendPre-demographic dividendQatarRomaniaRussian FederationRwandaSamoaSaudi ArabiaSenegalSerbiaSeychellesSierra LeoneSingaporeSlovak RepublicSloveniaSmall statesSomaliaSouth AfricaSouth AsiaSouth Asia (IDA & IBRD)SpainSri LankaSt. LuciaSt. Vincent and the GrenadinesSub-Saharan Africa Sub-Saharan Africa (excluding high income)Sub-Saharan Africa (IDA & IBRD countries)SudanSurinameSwedenSwitzerlandSyrian Arab RepublicTajikistanTanzaniaThailandTogoTrinidad and TobagoTunisiaTurkeyTurkmenistanUgandaUkraineUnited Arab EmiratesUnited KingdomUnited StatesUpper middle incomeUruguayUzbekistanVenezuela, RBVietnamWorldYemen, Rep.ZambiaZimbabwe Timeline:
This timeline shows a graph from 1961 to 2015 of Early-demographic dividend. No data until 1960. Number of actual observations by date: 55.
Source name:
World Development Indicators
Source organization:
World Bank staff estimates based data from International Monetary Fund's Direction of Trade database.
Categories, topics:
Private Sector, Trade
Last updated:
apr 23, 2017
Indicators value changes by year
At the date of observation
Value
Absolute change
Change from previous value
jan 1, 1961
2.301
+2.301
0.0%
jan 1, 1962
2.351
+0.05
2.16%
jan 1, 1963
2.031
-0.32
-13.61%
jan 1, 1964
2.017
-0.014
-0.7%
jan 1, 1965
2.675
+0.658
32.63%
jan 1, 1966
2.871
+0.197
7.35%
jan 1, 1967
2.466
-0.406
-14.13%
jan 1, 1968
2.473
+0.007
0.3%
jan 1, 1969
2.488
+0.015
0.62%
jan 1, 1970
2.396
-0.092
-3.7%
jan 1, 1971
2.484
+0.087
3.64%
jan 1, 1972
2.822
+0.338
13.61%
jan 1, 1973
2.414
-0.408
-14.44%
jan 1, 1974
2.376
-0.038
-1.57%
jan 1, 1975
3.13
+0.754
31.74%
jan 1, 1976
3.192
+0.061
1.96%
jan 1, 1977
3.143
-0.049
-1.54%
jan 1, 1978
3.418
+0.275
8.76%
jan 1, 1979
2.845
-0.573
-16.77%
jan 1, 1980
3.079
+0.235
8.25%
jan 1, 1981
2.829
-0.25
-8.13%
jan 1, 1982
3.93
+1.101
38.93%
jan 1, 1983
4.433
+0.503
12.8%
jan 1, 1984
4.494
+0.061
1.37%
jan 1, 1985
4.537
+0.043
0.96%
jan 1, 1986
4.768
+0.231
5.08%
jan 1, 1987
4.882
+0.114
2.4%
jan 1, 1988
4.709
-0.174
-3.56%
jan 1, 1989
4.544
-0.164
-3.49%
jan 1, 1990
4.207
-0.338
-7.43%
jan 1, 1991
4.454
+0.248
5.89%
jan 1, 1992
4.692
+0.238
5.34%
jan 1, 1993
4.558
-0.134
-2.85%
jan 1, 1994
4.643
+0.084
1.85%
jan 1, 1995
4.526
-0.116
-2.51%
jan 1, 1996
4.262
-0.264
-5.84%
jan 1, 1997
4.102
-0.16
-3.75%
jan 1, 1998
4.1
-0.003
-0.06%
jan 1, 1999
4.248
+0.148
3.62%
jan 1, 2000
3.953
-0.295
-6.94%
jan 1, 2001
3.315
-0.638
-16.15%
jan 1, 2002
3.991
+0.676
20.39%
jan 1, 2003
4.14
+0.149
3.75%
jan 1, 2004
4.452
+0.312
7.54%
jan 1, 2005
5.39
+0.938
21.06%
jan 1, 2006
5.411
+0.021
0.4%
jan 1, 2007
5.557
+0.146
2.69%
jan 1, 2008
6.12
+0.563
10.13%
jan 1, 2009
7.122
+1.003
16.39%
jan 1, 2010
8.043
+0.921
12.93%
jan 1, 2011
7.617
-0.426
-5.29%
jan 1, 2012
7.478
-0.139
-1.83%
jan 1, 2013
8.044
+0.566
7.57%
jan 1, 2014
8.971
+0.927
11.52%
jan 1, 2015
9.099
+0.129
1.43%
Ranking of countries by current statistics by years


Comments: