29
/
en
AIzaSyAYiBZKx7MnpbEhh9jyipgxe19OcubqV5w
April 1, 2024
214556
Norway
NOR
true
2
1
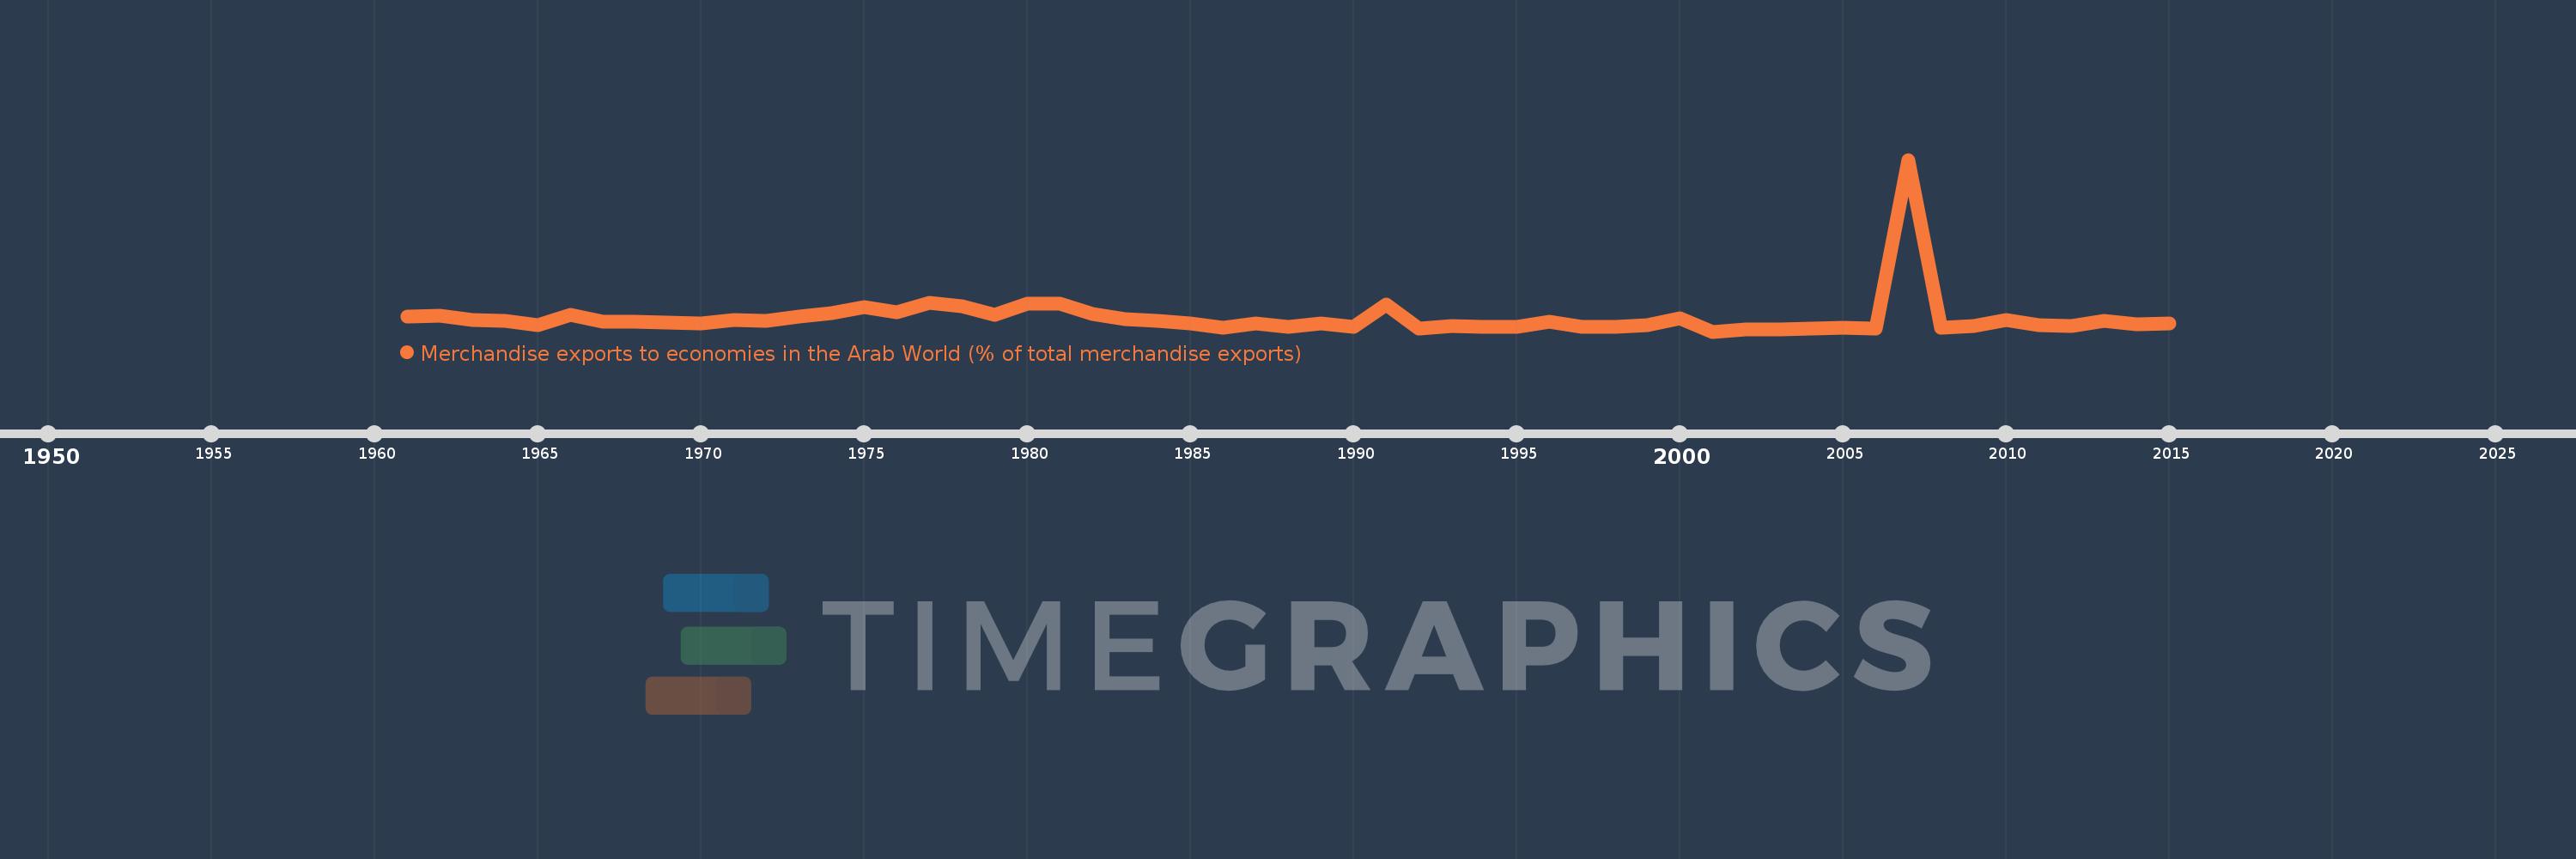
Merchandise exports to economies in the Arab World (% of total merchandise exports)
2015,2014,2013,2012,2011,2010,2009,2008,2007,2006,2005,2004,2003,2002,2001,2000,1999,1998,1997,1996,1995,1994,1993,1992,1991,1990,1989,1988,1987,1986,1985,1984,1983,1982,1981,1980,1979,1978,1977,1976,1975,1974,1973,1972,1971,1970,1969,1968,1967,1966,1965,1964,1963,1962,1961
This statistics in other country:
AfghanistanAlbaniaAlgeriaAngolaArab WorldArgentinaArmeniaArubaAustraliaAustriaAzerbaijanBahamas, TheBahrainBangladeshBarbadosBelarusBelgiumBelizeBeninBermudaBoliviaBosnia and HerzegovinaBrazilBrunei DarussalamBulgariaBurkina FasoBurundiCabo VerdeCambodiaCameroonCanadaCaribbean small statesCentral African RepublicCentral Europe and the BalticsChadChileChinaColombiaComorosCongo, Dem. Rep.Congo, Rep.Costa RicaCote d'IvoireCroatiaCubaCyprusCzech RepublicDenmarkDjiboutiDominicaDominican RepublicEarly-demographic dividendEast Asia & PacificEast Asia & Pacific (excluding high income)East Asia & Pacific (IDA & IBRD countries)EcuadorEgypt, Arab Rep.El SalvadorEstoniaEthiopiaEuro areaEurope & Central AsiaEurope & Central Asia (excluding high income)Europe & Central Asia (IDA & IBRD countries)European UnionFijiFinlandFragile and conflict affected situationsFranceGabonGambia, TheGeorgiaGermanyGhanaGreeceGreenlandGrenadaGuatemalaGuineaGuinea-BissauGuyanaHaitiHeavily indebted poor countries (HIPC)High incomeHondurasHong Kong SAR, ChinaHungaryIBRD onlyIcelandIDA & IBRD totalIDA blendIDA onlyIDA totalIndiaIndonesiaIran, Islamic Rep.IraqIrelandIsraelItalyJamaicaJapanJordanKazakhstanKenyaKorea, Dem. People’s Rep.Korea, Rep.KosovoKuwaitKyrgyz RepublicLao PDRLate-demographic dividendLatin America & Caribbean Latin America & Caribbean (excluding high income)Latin America & the Caribbean (IDA & IBRD countries)LatviaLeast developed countries: UN classificationLebanonLiberiaLibyaLithuaniaLow & middle incomeLow incomeLower middle incomeLuxembourgMacao SAR, ChinaMacedonia, FYRMadagascarMalawiMalaysiaMaldivesMaliMaltaMauritaniaMauritiusMexicoMiddle East & North AfricaMiddle East & North Africa (excluding high income)Middle East & North Africa (IDA & IBRD countries)Middle incomeMoldovaMongoliaMontenegroMoroccoMozambiqueMyanmarNepalNetherlandsNew CaledoniaNew ZealandNicaraguaNigerNigeriaNorth AmericaNorwayOECD membersOmanOther small statesPacific island small statesPakistanPanamaPapua New GuineaParaguayPeruPhilippinesPolandPortugalPost-demographic dividendPre-demographic dividendQatarRomaniaRussian FederationRwandaSamoaSaudi ArabiaSenegalSerbiaSeychellesSierra LeoneSingaporeSlovak RepublicSloveniaSmall statesSomaliaSouth AfricaSouth AsiaSouth Asia (IDA & IBRD)SpainSri LankaSt. LuciaSt. Vincent and the GrenadinesSub-Saharan Africa Sub-Saharan Africa (excluding high income)Sub-Saharan Africa (IDA & IBRD countries)SudanSurinameSwedenSwitzerlandSyrian Arab RepublicTajikistanTanzaniaThailandTogoTrinidad and TobagoTunisiaTurkeyTurkmenistanUgandaUkraineUnited Arab EmiratesUnited KingdomUnited StatesUpper middle incomeUruguayUzbekistanVenezuela, RBVietnamWorldYemen, Rep.ZambiaZimbabwe Timeline:
This timeline shows a graph from 1961 to 2015 of Norway. No data until 1960. Number of actual observations by date: 55.
Source name:
World Development Indicators
Source organization:
World Bank staff estimates based data from International Monetary Fund's Direction of Trade database.
Categories, topics:
Private Sector, Trade
Last updated:
apr 23, 2017
Indicators value changes by year
At the date of observation
Value
Absolute change
Change from previous value
jan 1, 1961
0.876
+0.876
0.0%
jan 1, 1962
0.917
+0.04
4.6%
jan 1, 1963
0.762
-0.154
-16.83%
jan 1, 1964
0.71
-0.053
-6.93%
jan 1, 1965
0.552
-0.158
-22.21%
jan 1, 1966
0.931
+0.379
68.66%
jan 1, 1967
0.692
-0.239
-25.63%
jan 1, 1968
0.686
-0.007
-0.98%
jan 1, 1969
0.656
-0.03
-4.34%
jan 1, 1970
0.599
-0.057
-8.69%
jan 1, 1971
0.744
+0.145
24.29%
jan 1, 1972
0.725
-0.019
-2.56%
jan 1, 1973
0.89
+0.165
22.74%
jan 1, 1974
1.003
+0.113
12.67%
jan 1, 1975
1.235
+0.232
23.18%
jan 1, 1976
1.032
-0.204
-16.49%
jan 1, 1977
1.41
+0.378
36.63%
jan 1, 1978
1.275
-0.134
-9.52%
jan 1, 1979
0.949
-0.326
-25.59%
jan 1, 1980
1.382
+0.433
45.67%
jan 1, 1981
1.355
-0.027
-1.99%
jan 1, 1982
0.964
-0.391
-28.89%
jan 1, 1983
0.777
-0.187
-19.36%
jan 1, 1984
0.714
-0.063
-8.15%
jan 1, 1985
0.608
-0.106
-14.83%
jan 1, 1986
0.459
-0.149
-24.55%
jan 1, 1987
0.601
+0.143
31.1%
jan 1, 1988
0.494
-0.108
-17.89%
jan 1, 1989
0.613
+0.119
24.1%
jan 1, 1990
0.48
-0.133
-21.71%
jan 1, 1991
1.325
+0.845
176.25%
jan 1, 1992
0.423
-0.902
-68.07%
jan 1, 1993
0.511
+0.088
20.81%
jan 1, 1994
0.492
-0.019
-3.76%
jan 1, 1995
0.497
+0.005
0.98%
jan 1, 1996
0.678
+0.181
36.41%
jan 1, 1997
0.475
-0.203
-29.91%
jan 1, 1998
0.499
+0.024
5.02%
jan 1, 1999
0.554
+0.056
11.16%
jan 1, 2000
0.819
+0.265
47.7%
jan 1, 2001
0.302
-0.517
-63.07%
jan 1, 2002
0.37
+0.067
22.26%
jan 1, 2003
0.375
+0.005
1.38%
jan 1, 2004
0.425
+0.05
13.36%
jan 1, 2005
0.442
+0.017
4.03%
jan 1, 2006
0.41
-0.032
-7.29%
jan 1, 2007
6.88
+6.47
1.58K%
jan 1, 2008
0.456
-6.424
-93.37%
jan 1, 2009
0.516
+0.06
13.24%
jan 1, 2010
0.758
+0.241
46.77%
jan 1, 2011
0.534
-0.224
-29.52%
jan 1, 2012
0.508
-0.026
-4.87%
jan 1, 2013
0.723
+0.215
42.25%
jan 1, 2014
0.573
-0.149
-20.68%
jan 1, 2015
0.613
+0.04
7.02%
Ranking of countries by current statistics by years


Comments: