29
/
en
AIzaSyAYiBZKx7MnpbEhh9jyipgxe19OcubqV5w
April 1, 2024
123776
Ecuador
ECU
true
2
1
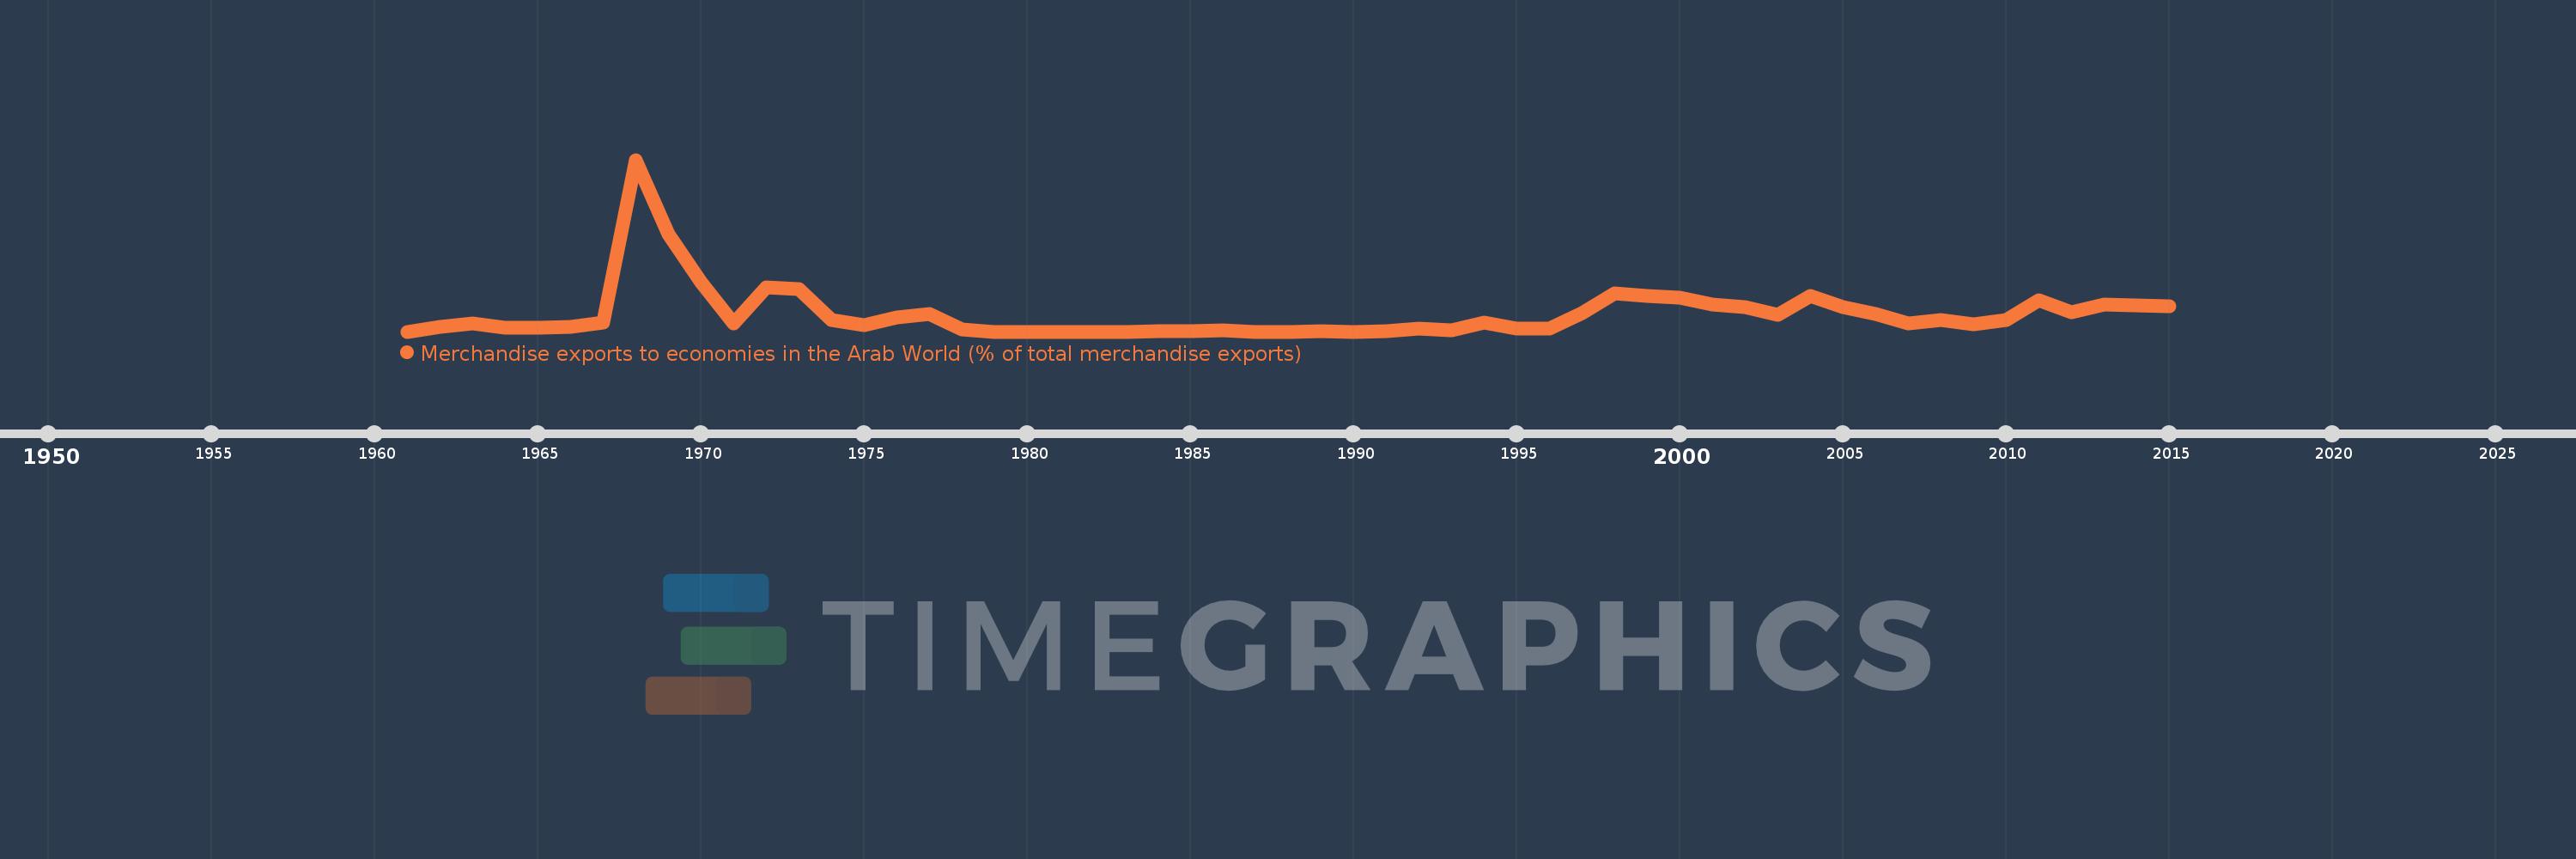
Merchandise exports to economies in the Arab World (% of total merchandise exports)
2015,2014,2013,2012,2011,2010,2009,2008,2007,2006,2005,2004,2003,2002,2001,2000,1999,1998,1997,1996,1995,1994,1993,1992,1991,1990,1989,1988,1987,1986,1985,1984,1983,1982,1981,1980,1979,1978,1977,1976,1975,1974,1973,1972,1971,1970,1969,1968,1967,1966,1965,1964,1963,1962,1961
This statistics in other country:
AfghanistanAlbaniaAlgeriaAngolaArab WorldArgentinaArmeniaArubaAustraliaAustriaAzerbaijanBahamas, TheBahrainBangladeshBarbadosBelarusBelgiumBelizeBeninBermudaBoliviaBosnia and HerzegovinaBrazilBrunei DarussalamBulgariaBurkina FasoBurundiCabo VerdeCambodiaCameroonCanadaCaribbean small statesCentral African RepublicCentral Europe and the BalticsChadChileChinaColombiaComorosCongo, Dem. Rep.Congo, Rep.Costa RicaCote d'IvoireCroatiaCubaCyprusCzech RepublicDenmarkDjiboutiDominicaDominican RepublicEarly-demographic dividendEast Asia & PacificEast Asia & Pacific (excluding high income)East Asia & Pacific (IDA & IBRD countries)EcuadorEgypt, Arab Rep.El SalvadorEstoniaEthiopiaEuro areaEurope & Central AsiaEurope & Central Asia (excluding high income)Europe & Central Asia (IDA & IBRD countries)European UnionFijiFinlandFragile and conflict affected situationsFranceGabonGambia, TheGeorgiaGermanyGhanaGreeceGreenlandGrenadaGuatemalaGuineaGuinea-BissauGuyanaHaitiHeavily indebted poor countries (HIPC)High incomeHondurasHong Kong SAR, ChinaHungaryIBRD onlyIcelandIDA & IBRD totalIDA blendIDA onlyIDA totalIndiaIndonesiaIran, Islamic Rep.IraqIrelandIsraelItalyJamaicaJapanJordanKazakhstanKenyaKorea, Dem. People’s Rep.Korea, Rep.KosovoKuwaitKyrgyz RepublicLao PDRLate-demographic dividendLatin America & Caribbean Latin America & Caribbean (excluding high income)Latin America & the Caribbean (IDA & IBRD countries)LatviaLeast developed countries: UN classificationLebanonLiberiaLibyaLithuaniaLow & middle incomeLow incomeLower middle incomeLuxembourgMacao SAR, ChinaMacedonia, FYRMadagascarMalawiMalaysiaMaldivesMaliMaltaMauritaniaMauritiusMexicoMiddle East & North AfricaMiddle East & North Africa (excluding high income)Middle East & North Africa (IDA & IBRD countries)Middle incomeMoldovaMongoliaMontenegroMoroccoMozambiqueMyanmarNepalNetherlandsNew CaledoniaNew ZealandNicaraguaNigerNigeriaNorth AmericaNorwayOECD membersOmanOther small statesPacific island small statesPakistanPanamaPapua New GuineaParaguayPeruPhilippinesPolandPortugalPost-demographic dividendPre-demographic dividendQatarRomaniaRussian FederationRwandaSamoaSaudi ArabiaSenegalSerbiaSeychellesSierra LeoneSingaporeSlovak RepublicSloveniaSmall statesSomaliaSouth AfricaSouth AsiaSouth Asia (IDA & IBRD)SpainSri LankaSt. LuciaSt. Vincent and the GrenadinesSub-Saharan Africa Sub-Saharan Africa (excluding high income)Sub-Saharan Africa (IDA & IBRD countries)SudanSurinameSwedenSwitzerlandSyrian Arab RepublicTajikistanTanzaniaThailandTogoTrinidad and TobagoTunisiaTurkeyTurkmenistanUgandaUkraineUnited Arab EmiratesUnited KingdomUnited StatesUpper middle incomeUruguayUzbekistanVenezuela, RBVietnamWorldYemen, Rep.ZambiaZimbabwe Timeline:
This timeline shows a graph from 1961 to 2015 of Ecuador. No data until 1960. Number of actual observations by date: 55.
Source name:
World Development Indicators
Source organization:
World Bank staff estimates based data from International Monetary Fund's Direction of Trade database.
Categories, topics:
Private Sector, Trade
Last updated:
apr 23, 2017
Indicators value changes by year
At the date of observation
Value
Absolute change
Change from previous value
jan 1, 1962
0.104
+0.104
%
jan 1, 1963
0.171
+0.068
65.24%
jan 1, 1964
0.077
-0.094
-55.01%
jan 1, 1965
0.077
+0.0
0.08%
jan 1, 1966
0.106
+0.029
37.59%
jan 1, 1967
0.186
+0.08
75.41%
jan 1, 1968
3.606
+3.419
1.84K%
jan 1, 1969
2.044
-1.561
-43.3%
jan 1, 1970
1.03
-1.014
-49.62%
jan 1, 1971
0.176
-0.854
-82.92%
jan 1, 1972
0.923
+0.747
424.41%
jan 1, 1973
0.898
-0.025
-2.69%
jan 1, 1974
0.252
-0.646
-71.98%
jan 1, 1975
0.134
-0.117
-46.59%
jan 1, 1976
0.293
+0.158
117.93%
jan 1, 1977
0.364
+0.071
24.4%
jan 1, 1978
0.049
-0.316
-86.65%
jan 1, 1979
0.0
-0.049
-100.0%
jan 1, 1984
0.009
+0.009
%
jan 1, 1985
0.002
-0.007
-82.73%
jan 1, 1986
0.02
+0.018
1.17K%
jan 1, 1987
0.0
-0.02
-100.0%
jan 1, 1989
0.002
+0.002
%
jan 1, 1990
0.0
-0.002
-81.37%
jan 1, 1991
0.017
+0.016
4.46K%
jan 1, 1992
0.065
+0.049
291.79%
jan 1, 1993
0.028
-0.038
-57.67%
jan 1, 1994
0.181
+0.153
553.34%
jan 1, 1995
0.068
-0.113
-62.49%
jan 1, 1996
0.072
+0.004
6.59%
jan 1, 1997
0.393
+0.321
445.1%
jan 1, 1998
0.795
+0.401
102.03%
jan 1, 1999
0.747
-0.048
-6.03%
jan 1, 2000
0.717
-0.03
-4.02%
jan 1, 2001
0.571
-0.146
-20.3%
jan 1, 2002
0.518
-0.054
-9.37%
jan 1, 2003
0.347
-0.171
-33.03%
jan 1, 2004
0.749
+0.402
115.92%
jan 1, 2005
0.509
-0.24
-32.07%
jan 1, 2006
0.376
-0.133
-26.16%
jan 1, 2007
0.173
-0.202
-53.91%
jan 1, 2008
0.252
+0.079
45.45%
jan 1, 2009
0.159
-0.093
-37.01%
jan 1, 2010
0.239
+0.081
50.8%
jan 1, 2011
0.665
+0.426
177.96%
jan 1, 2012
0.408
-0.256
-38.55%
jan 1, 2013
0.571
+0.163
39.82%
jan 1, 2014
0.557
-0.014
-2.45%
jan 1, 2015
0.524
-0.033
-6.0%
Ranking of countries by current statistics by years


Comments: