29
/
en
AIzaSyAYiBZKx7MnpbEhh9jyipgxe19OcubqV5w
April 1, 2024
74154
Austria
AUT
true
2
1
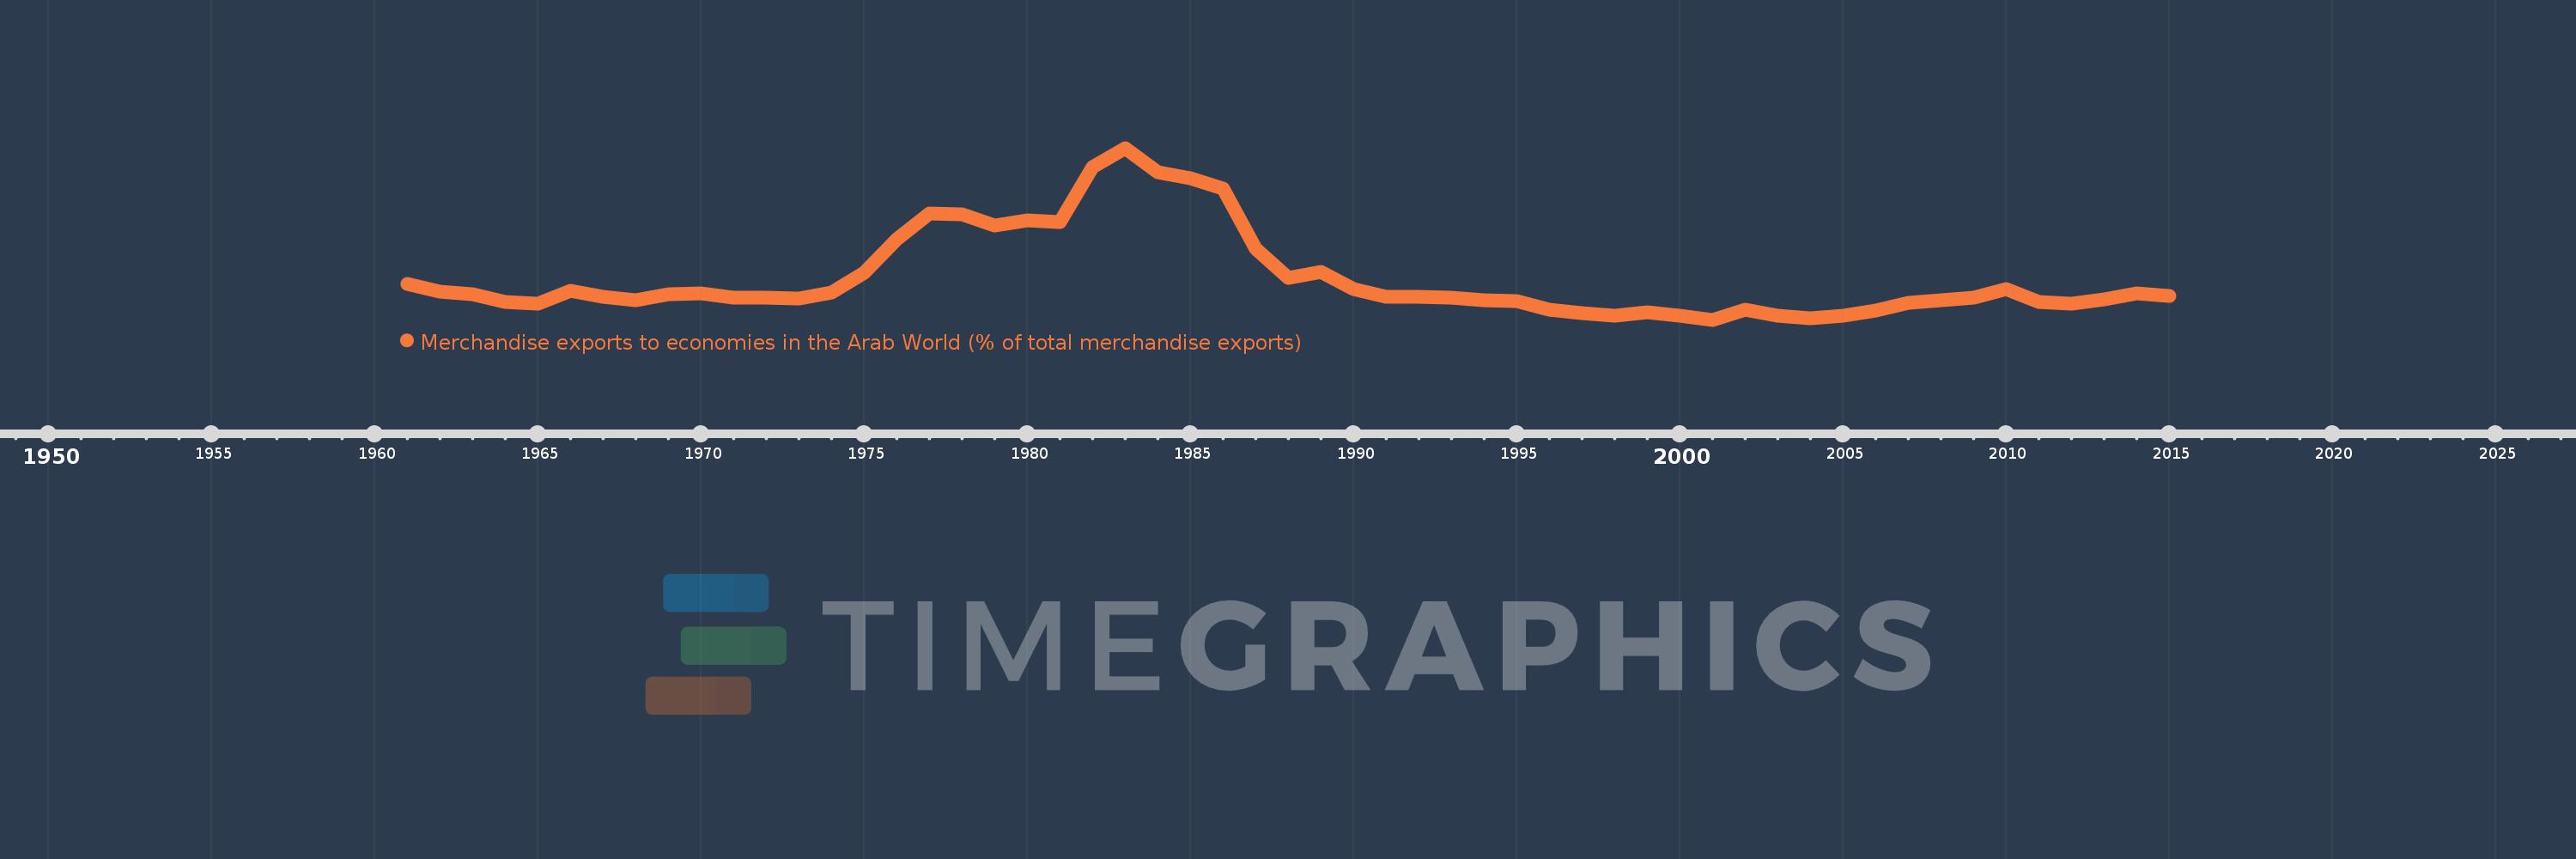
Merchandise exports to economies in the Arab World (% of total merchandise exports)
2015,2014,2013,2012,2011,2010,2009,2008,2007,2006,2005,2004,2003,2002,2001,2000,1999,1998,1997,1996,1995,1994,1993,1992,1991,1990,1989,1988,1987,1986,1985,1984,1983,1982,1981,1980,1979,1978,1977,1976,1975,1974,1973,1972,1971,1970,1969,1968,1967,1966,1965,1964,1963,1962,1961
This statistics in other country:
AfghanistanAlbaniaAlgeriaAngolaArab WorldArgentinaArmeniaArubaAustraliaAustriaAzerbaijanBahamas, TheBahrainBangladeshBarbadosBelarusBelgiumBelizeBeninBermudaBoliviaBosnia and HerzegovinaBrazilBrunei DarussalamBulgariaBurkina FasoBurundiCabo VerdeCambodiaCameroonCanadaCaribbean small statesCentral African RepublicCentral Europe and the BalticsChadChileChinaColombiaComorosCongo, Dem. Rep.Congo, Rep.Costa RicaCote d'IvoireCroatiaCubaCyprusCzech RepublicDenmarkDjiboutiDominicaDominican RepublicEarly-demographic dividendEast Asia & PacificEast Asia & Pacific (excluding high income)East Asia & Pacific (IDA & IBRD countries)EcuadorEgypt, Arab Rep.El SalvadorEstoniaEthiopiaEuro areaEurope & Central AsiaEurope & Central Asia (excluding high income)Europe & Central Asia (IDA & IBRD countries)European UnionFijiFinlandFragile and conflict affected situationsFranceGabonGambia, TheGeorgiaGermanyGhanaGreeceGreenlandGrenadaGuatemalaGuineaGuinea-BissauGuyanaHaitiHeavily indebted poor countries (HIPC)High incomeHondurasHong Kong SAR, ChinaHungaryIBRD onlyIcelandIDA & IBRD totalIDA blendIDA onlyIDA totalIndiaIndonesiaIran, Islamic Rep.IraqIrelandIsraelItalyJamaicaJapanJordanKazakhstanKenyaKorea, Dem. People’s Rep.Korea, Rep.KosovoKuwaitKyrgyz RepublicLao PDRLate-demographic dividendLatin America & Caribbean Latin America & Caribbean (excluding high income)Latin America & the Caribbean (IDA & IBRD countries)LatviaLeast developed countries: UN classificationLebanonLiberiaLibyaLithuaniaLow & middle incomeLow incomeLower middle incomeLuxembourgMacao SAR, ChinaMacedonia, FYRMadagascarMalawiMalaysiaMaldivesMaliMaltaMauritaniaMauritiusMexicoMiddle East & North AfricaMiddle East & North Africa (excluding high income)Middle East & North Africa (IDA & IBRD countries)Middle incomeMoldovaMongoliaMontenegroMoroccoMozambiqueMyanmarNepalNetherlandsNew CaledoniaNew ZealandNicaraguaNigerNigeriaNorth AmericaNorwayOECD membersOmanOther small statesPacific island small statesPakistanPanamaPapua New GuineaParaguayPeruPhilippinesPolandPortugalPost-demographic dividendPre-demographic dividendQatarRomaniaRussian FederationRwandaSamoaSaudi ArabiaSenegalSerbiaSeychellesSierra LeoneSingaporeSlovak RepublicSloveniaSmall statesSomaliaSouth AfricaSouth AsiaSouth Asia (IDA & IBRD)SpainSri LankaSt. LuciaSt. Vincent and the GrenadinesSub-Saharan Africa Sub-Saharan Africa (excluding high income)Sub-Saharan Africa (IDA & IBRD countries)SudanSurinameSwedenSwitzerlandSyrian Arab RepublicTajikistanTanzaniaThailandTogoTrinidad and TobagoTunisiaTurkeyTurkmenistanUgandaUkraineUnited Arab EmiratesUnited KingdomUnited StatesUpper middle incomeUruguayUzbekistanVenezuela, RBVietnamWorldYemen, Rep.ZambiaZimbabwe Timeline:
This timeline shows a graph from 1961 to 2015 of Austria. No data until 1960. Number of actual observations by date: 55.
Source name:
World Development Indicators
Source organization:
World Bank staff estimates based data from International Monetary Fund's Direction of Trade database.
Categories, topics:
Private Sector, Trade
Last updated:
apr 23, 2017
Indicators value changes by year
At the date of observation
Value
Absolute change
Change from previous value
jan 1, 1961
2.359
+2.359
0.0%
jan 1, 1962
2.1
-0.259
-11.0%
jan 1, 1963
1.998
-0.102
-4.86%
jan 1, 1964
1.732
-0.266
-13.32%
jan 1, 1965
1.668
-0.064
-3.69%
jan 1, 1966
2.106
+0.438
26.25%
jan 1, 1967
1.914
-0.192
-9.12%
jan 1, 1968
1.774
-0.14
-7.32%
jan 1, 1969
1.99
+0.216
12.2%
jan 1, 1970
2.044
+0.054
2.71%
jan 1, 1971
1.871
-0.173
-8.47%
jan 1, 1972
1.875
+0.004
0.19%
jan 1, 1973
1.848
-0.026
-1.41%
jan 1, 1974
2.067
+0.219
11.85%
jan 1, 1975
2.775
+0.708
34.25%
jan 1, 1976
3.954
+1.179
42.49%
jan 1, 1977
4.875
+0.921
23.29%
jan 1, 1978
4.847
-0.028
-0.58%
jan 1, 1979
4.428
-0.419
-8.65%
jan 1, 1980
4.621
+0.194
4.37%
jan 1, 1981
4.569
-0.053
-1.14%
jan 1, 1982
6.5
+1.931
42.27%
jan 1, 1983
7.193
+0.693
10.67%
jan 1, 1984
6.323
-0.871
-12.1%
jan 1, 1985
6.12
-0.203
-3.21%
jan 1, 1986
5.753
-0.367
-6.0%
jan 1, 1987
3.607
-2.146
-37.31%
jan 1, 1988
2.573
-1.034
-28.67%
jan 1, 1989
2.791
+0.218
8.49%
jan 1, 1990
2.176
-0.615
-22.03%
jan 1, 1991
1.893
-0.283
-13.02%
jan 1, 1992
1.899
+0.006
0.33%
jan 1, 1993
1.862
-0.037
-1.92%
jan 1, 1994
1.774
-0.089
-4.75%
jan 1, 1995
1.757
-0.017
-0.94%
jan 1, 1996
1.453
-0.304
-17.32%
jan 1, 1997
1.325
-0.128
-8.81%
jan 1, 1998
1.233
-0.092
-6.92%
jan 1, 1999
1.364
+0.131
10.6%
jan 1, 2000
1.232
-0.132
-9.64%
jan 1, 2001
1.093
-0.14
-11.34%
jan 1, 2002
1.446
+0.353
32.3%
jan 1, 2003
1.246
-0.199
-13.8%
jan 1, 2004
1.158
-0.088
-7.03%
jan 1, 2005
1.225
+0.067
5.78%
jan 1, 2006
1.414
+0.188
15.35%
jan 1, 2007
1.696
+0.282
19.97%
jan 1, 2008
1.774
+0.078
4.62%
jan 1, 2009
1.89
+0.116
6.51%
jan 1, 2010
2.183
+0.293
15.5%
jan 1, 2011
1.734
-0.449
-20.56%
jan 1, 2012
1.655
-0.079
-4.54%
jan 1, 2013
1.805
+0.15
9.03%
jan 1, 2014
2.021
+0.216
11.98%
jan 1, 2015
1.924
-0.097
-4.81%
Ranking of countries by current statistics by years


Comments: