29
/
en
AIzaSyAYiBZKx7MnpbEhh9jyipgxe19OcubqV5w
April 1, 2024
216708
Pakistan
PAK
true
2
1
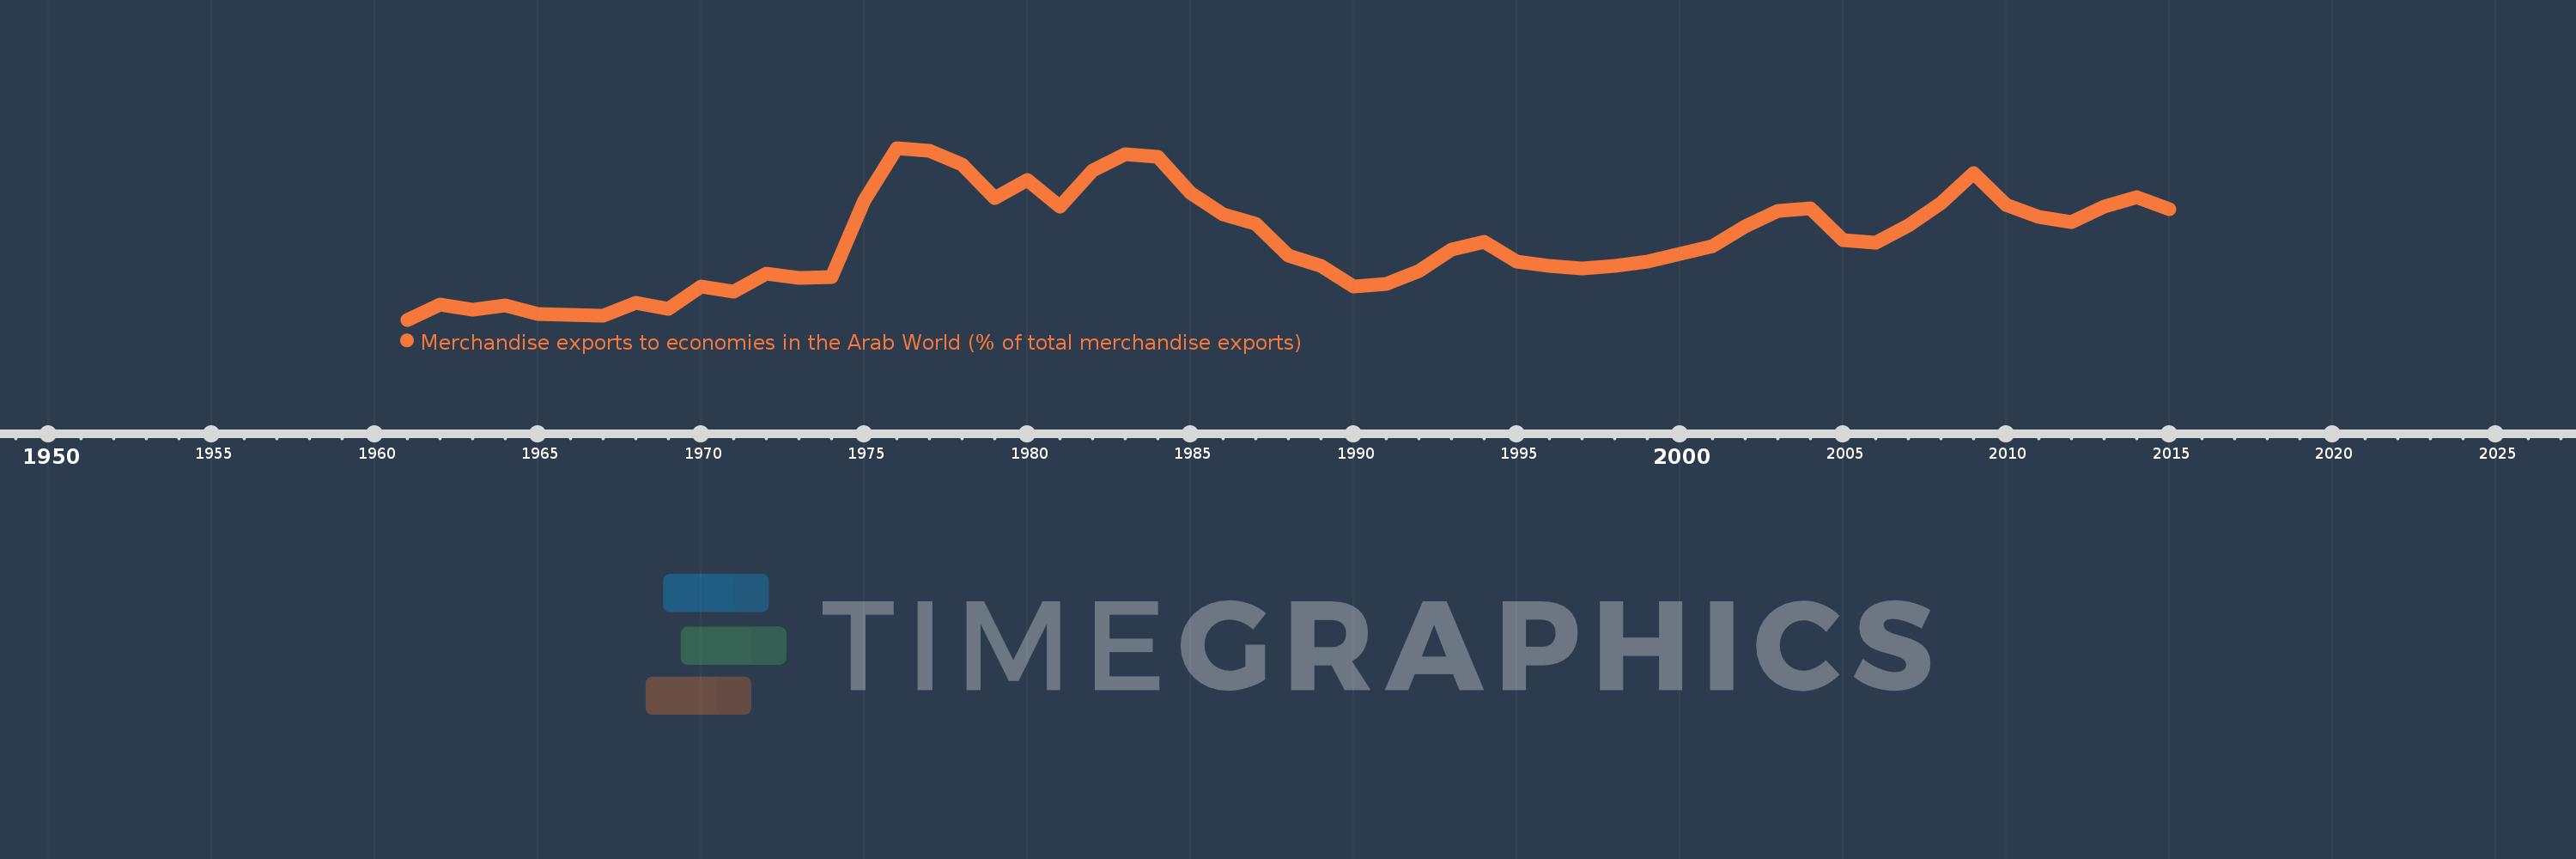
Merchandise exports to economies in the Arab World (% of total merchandise exports)
2015,2014,2013,2012,2011,2010,2009,2008,2007,2006,2005,2004,2003,2002,2001,2000,1999,1998,1997,1996,1995,1994,1993,1992,1991,1990,1989,1988,1987,1986,1985,1984,1983,1982,1981,1980,1979,1978,1977,1976,1975,1974,1973,1972,1971,1970,1969,1968,1967,1966,1965,1964,1963,1962,1961
This statistics in other country:
AfghanistanAlbaniaAlgeriaAngolaArab WorldArgentinaArmeniaArubaAustraliaAustriaAzerbaijanBahamas, TheBahrainBangladeshBarbadosBelarusBelgiumBelizeBeninBermudaBoliviaBosnia and HerzegovinaBrazilBrunei DarussalamBulgariaBurkina FasoBurundiCabo VerdeCambodiaCameroonCanadaCaribbean small statesCentral African RepublicCentral Europe and the BalticsChadChileChinaColombiaComorosCongo, Dem. Rep.Congo, Rep.Costa RicaCote d'IvoireCroatiaCubaCyprusCzech RepublicDenmarkDjiboutiDominicaDominican RepublicEarly-demographic dividendEast Asia & PacificEast Asia & Pacific (excluding high income)East Asia & Pacific (IDA & IBRD countries)EcuadorEgypt, Arab Rep.El SalvadorEstoniaEthiopiaEuro areaEurope & Central AsiaEurope & Central Asia (excluding high income)Europe & Central Asia (IDA & IBRD countries)European UnionFijiFinlandFragile and conflict affected situationsFranceGabonGambia, TheGeorgiaGermanyGhanaGreeceGreenlandGrenadaGuatemalaGuineaGuinea-BissauGuyanaHaitiHeavily indebted poor countries (HIPC)High incomeHondurasHong Kong SAR, ChinaHungaryIBRD onlyIcelandIDA & IBRD totalIDA blendIDA onlyIDA totalIndiaIndonesiaIran, Islamic Rep.IraqIrelandIsraelItalyJamaicaJapanJordanKazakhstanKenyaKorea, Dem. People’s Rep.Korea, Rep.KosovoKuwaitKyrgyz RepublicLao PDRLate-demographic dividendLatin America & Caribbean Latin America & Caribbean (excluding high income)Latin America & the Caribbean (IDA & IBRD countries)LatviaLeast developed countries: UN classificationLebanonLiberiaLibyaLithuaniaLow & middle incomeLow incomeLower middle incomeLuxembourgMacao SAR, ChinaMacedonia, FYRMadagascarMalawiMalaysiaMaldivesMaliMaltaMauritaniaMauritiusMexicoMiddle East & North AfricaMiddle East & North Africa (excluding high income)Middle East & North Africa (IDA & IBRD countries)Middle incomeMoldovaMongoliaMontenegroMoroccoMozambiqueMyanmarNepalNetherlandsNew CaledoniaNew ZealandNicaraguaNigerNigeriaNorth AmericaNorwayOECD membersOmanOther small statesPacific island small statesPakistanPanamaPapua New GuineaParaguayPeruPhilippinesPolandPortugalPost-demographic dividendPre-demographic dividendQatarRomaniaRussian FederationRwandaSamoaSaudi ArabiaSenegalSerbiaSeychellesSierra LeoneSingaporeSlovak RepublicSloveniaSmall statesSomaliaSouth AfricaSouth AsiaSouth Asia (IDA & IBRD)SpainSri LankaSt. LuciaSt. Vincent and the GrenadinesSub-Saharan Africa Sub-Saharan Africa (excluding high income)Sub-Saharan Africa (IDA & IBRD countries)SudanSurinameSwedenSwitzerlandSyrian Arab RepublicTajikistanTanzaniaThailandTogoTrinidad and TobagoTunisiaTurkeyTurkmenistanUgandaUkraineUnited Arab EmiratesUnited KingdomUnited StatesUpper middle incomeUruguayUzbekistanVenezuela, RBVietnamWorldYemen, Rep.ZambiaZimbabwe Timeline:
This timeline shows a graph from 1961 to 2015 of Pakistan. No data until 1960. Number of actual observations by date: 55.
Source name:
World Development Indicators
Source organization:
World Bank staff estimates based data from International Monetary Fund's Direction of Trade database.
Categories, topics:
Private Sector, Trade
Last updated:
apr 23, 2017
Indicators value changes by year
Maximum:
23.451
jan 1, 1976
At the date of observation
Value
Absolute change
Change from previous value
jan 1, 1961
4.543
+4.543
0.0%
jan 1, 1962
6.245
+1.702
37.47%
jan 1, 1963
5.639
-0.606
-9.7%
jan 1, 1964
6.115
+0.476
8.44%
jan 1, 1965
5.154
-0.961
-15.71%
jan 1, 1966
5.098
-0.056
-1.09%
jan 1, 1967
5.034
-0.065
-1.27%
jan 1, 1968
6.381
+1.347
26.77%
jan 1, 1969
5.769
-0.612
-9.59%
jan 1, 1970
8.232
+2.463
42.69%
jan 1, 1971
7.642
-0.59
-7.16%
jan 1, 1972
9.661
+2.018
26.41%
jan 1, 1973
9.117
-0.544
-5.63%
jan 1, 1974
9.274
+0.157
1.72%
jan 1, 1975
17.696
+8.423
90.82%
jan 1, 1976
23.451
+5.754
32.52%
jan 1, 1977
23.122
-0.329
-1.4%
jan 1, 1978
21.633
-1.489
-6.44%
jan 1, 1979
17.924
-3.708
-17.14%
jan 1, 1980
19.926
+2.002
11.17%
jan 1, 1981
17.024
-2.902
-14.56%
jan 1, 1982
20.96
+3.936
23.12%
jan 1, 1983
22.758
+1.798
8.58%
jan 1, 1984
22.5
-0.258
-1.13%
jan 1, 1985
18.524
-3.976
-17.67%
jan 1, 1986
16.135
-2.39
-12.9%
jan 1, 1987
15.09
-1.045
-6.48%
jan 1, 1988
11.582
-3.507
-23.24%
jan 1, 1989
10.48
-1.102
-9.51%
jan 1, 1990
8.207
-2.273
-21.69%
jan 1, 1991
8.44
+0.233
2.84%
jan 1, 1992
9.862
+1.422
16.85%
jan 1, 1993
12.266
+2.404
24.37%
jan 1, 1994
13.122
+0.856
6.98%
jan 1, 1995
10.965
-2.157
-16.44%
jan 1, 1996
10.516
-0.448
-4.09%
jan 1, 1997
10.149
-0.368
-3.5%
jan 1, 1998
10.493
+0.344
3.39%
jan 1, 1999
10.955
+0.462
4.4%
jan 1, 2000
11.754
+0.799
7.3%
jan 1, 2001
12.641
+0.887
7.54%
jan 1, 2002
14.848
+2.207
17.46%
jan 1, 2003
16.506
+1.658
11.17%
jan 1, 2004
16.773
+0.267
1.62%
jan 1, 2005
13.321
-3.452
-20.58%
jan 1, 2006
12.997
-0.323
-2.43%
jan 1, 2007
14.958
+1.961
15.08%
jan 1, 2008
17.334
+2.376
15.89%
jan 1, 2009
20.648
+3.313
19.11%
jan 1, 2010
17.197
-3.451
-16.71%
jan 1, 2011
15.827
-1.37
-7.97%
jan 1, 2012
15.318
-0.509
-3.21%
jan 1, 2013
16.948
+1.63
10.64%
jan 1, 2014
18.015
+1.067
6.3%
jan 1, 2015
16.667
-1.348
-7.48%
Ranking of countries by current statistics by years


Comments: