29
/
en
AIzaSyAYiBZKx7MnpbEhh9jyipgxe19OcubqV5w
April 1, 2024
190502
Mali
MLI
true
2
1
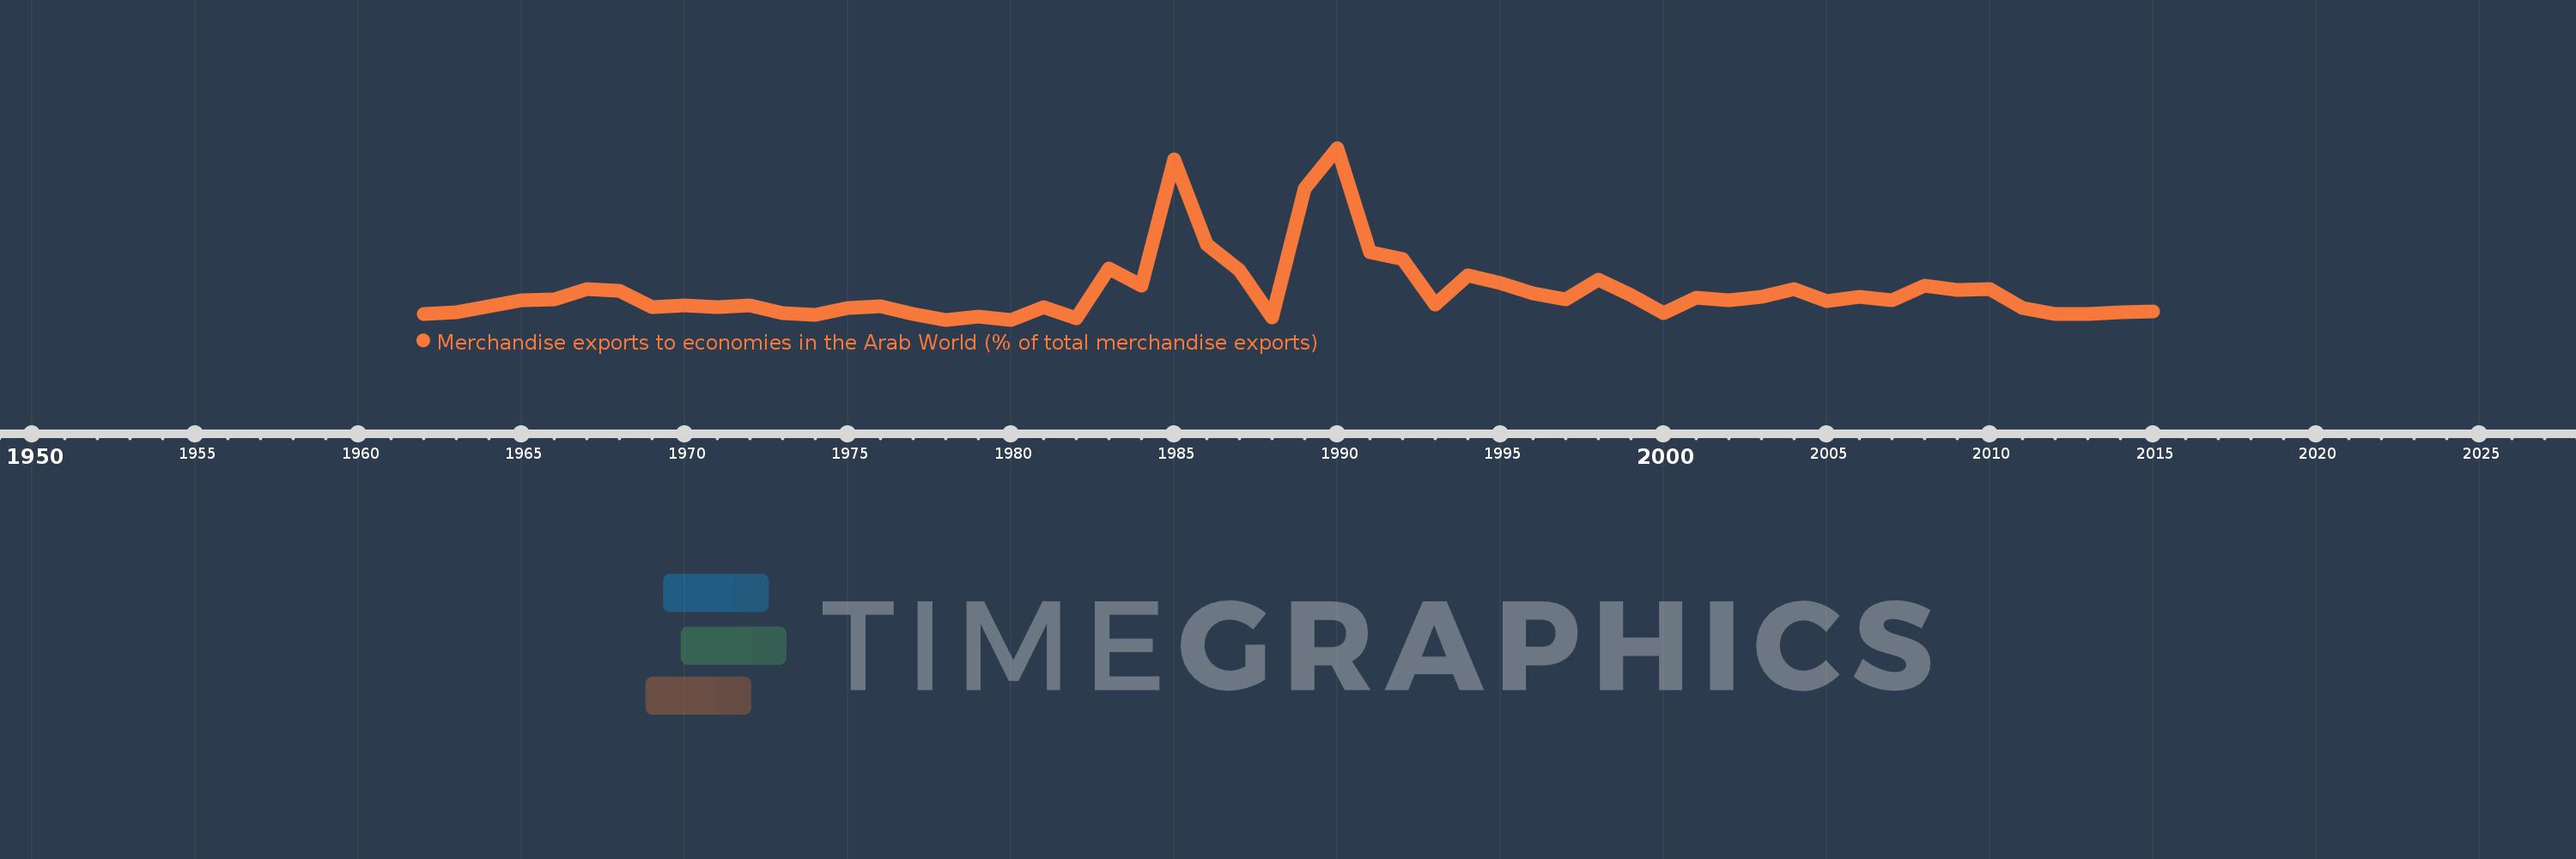
Merchandise exports to economies in the Arab World (% of total merchandise exports)
2015,2014,2013,2012,2011,2010,2009,2008,2007,2006,2005,2004,2003,2002,2001,2000,1999,1998,1997,1996,1995,1994,1993,1992,1991,1990,1989,1988,1987,1986,1985,1984,1983,1982,1981,1980,1979,1978,1977,1976,1975,1974,1973,1972,1971,1970,1969,1968,1967,1966,1965,1964,1963,1962
This statistics in other country:
AfghanistanAlbaniaAlgeriaAngolaArab WorldArgentinaArmeniaArubaAustraliaAustriaAzerbaijanBahamas, TheBahrainBangladeshBarbadosBelarusBelgiumBelizeBeninBermudaBoliviaBosnia and HerzegovinaBrazilBrunei DarussalamBulgariaBurkina FasoBurundiCabo VerdeCambodiaCameroonCanadaCaribbean small statesCentral African RepublicCentral Europe and the BalticsChadChileChinaColombiaComorosCongo, Dem. Rep.Congo, Rep.Costa RicaCote d'IvoireCroatiaCubaCyprusCzech RepublicDenmarkDjiboutiDominicaDominican RepublicEarly-demographic dividendEast Asia & PacificEast Asia & Pacific (excluding high income)East Asia & Pacific (IDA & IBRD countries)EcuadorEgypt, Arab Rep.El SalvadorEstoniaEthiopiaEuro areaEurope & Central AsiaEurope & Central Asia (excluding high income)Europe & Central Asia (IDA & IBRD countries)European UnionFijiFinlandFragile and conflict affected situationsFranceGabonGambia, TheGeorgiaGermanyGhanaGreeceGreenlandGrenadaGuatemalaGuineaGuinea-BissauGuyanaHaitiHeavily indebted poor countries (HIPC)High incomeHondurasHong Kong SAR, ChinaHungaryIBRD onlyIcelandIDA & IBRD totalIDA blendIDA onlyIDA totalIndiaIndonesiaIran, Islamic Rep.IraqIrelandIsraelItalyJamaicaJapanJordanKazakhstanKenyaKorea, Dem. People’s Rep.Korea, Rep.KosovoKuwaitKyrgyz RepublicLao PDRLate-demographic dividendLatin America & Caribbean Latin America & Caribbean (excluding high income)Latin America & the Caribbean (IDA & IBRD countries)LatviaLeast developed countries: UN classificationLebanonLiberiaLibyaLithuaniaLow & middle incomeLow incomeLower middle incomeLuxembourgMacao SAR, ChinaMacedonia, FYRMadagascarMalawiMalaysiaMaldivesMaliMaltaMauritaniaMauritiusMexicoMiddle East & North AfricaMiddle East & North Africa (excluding high income)Middle East & North Africa (IDA & IBRD countries)Middle incomeMoldovaMongoliaMontenegroMoroccoMozambiqueMyanmarNepalNetherlandsNew CaledoniaNew ZealandNicaraguaNigerNigeriaNorth AmericaNorwayOECD membersOmanOther small statesPacific island small statesPakistanPanamaPapua New GuineaParaguayPeruPhilippinesPolandPortugalPost-demographic dividendPre-demographic dividendQatarRomaniaRussian FederationRwandaSamoaSaudi ArabiaSenegalSerbiaSeychellesSierra LeoneSingaporeSlovak RepublicSloveniaSmall statesSomaliaSouth AfricaSouth AsiaSouth Asia (IDA & IBRD)SpainSri LankaSt. LuciaSt. Vincent and the GrenadinesSub-Saharan Africa Sub-Saharan Africa (excluding high income)Sub-Saharan Africa (IDA & IBRD countries)SudanSurinameSwedenSwitzerlandSyrian Arab RepublicTajikistanTanzaniaThailandTogoTrinidad and TobagoTunisiaTurkeyTurkmenistanUgandaUkraineUnited Arab EmiratesUnited KingdomUnited StatesUpper middle incomeUruguayUzbekistanVenezuela, RBVietnamWorldYemen, Rep.ZambiaZimbabwe Timeline:
This timeline shows a graph from 1962 to 2015 of Mali. No data until 1961. Number of actual observations by date: 54.
Source name:
World Development Indicators
Source organization:
World Bank staff estimates based data from International Monetary Fund's Direction of Trade database.
Categories, topics:
Private Sector, Trade
Last updated:
apr 23, 2017
Indicators value changes by year
Maximum:
21.544
jan 1, 1990
At the date of observation
Value
Absolute change
Change from previous value
jan 1, 1962
0.714
+0.714
0.0%
jan 1, 1963
0.99
+0.276
38.61%
jan 1, 1964
1.684
+0.693
70.04%
jan 1, 1965
2.439
+0.755
44.87%
jan 1, 1966
2.581
+0.142
5.81%
jan 1, 1967
3.846
+1.266
49.04%
jan 1, 1968
3.659
-0.188
-4.88%
jan 1, 1969
1.581
-2.078
-56.79%
jan 1, 1970
1.814
+0.233
14.73%
jan 1, 1971
1.62
-0.194
-10.69%
jan 1, 1972
1.753
+0.133
8.2%
jan 1, 1973
0.858
-0.895
-51.06%
jan 1, 1974
0.583
-0.274
-31.99%
jan 1, 1975
1.439
+0.856
146.71%
jan 1, 1976
1.7
+0.26
18.09%
jan 1, 1977
0.722
-0.978
-57.54%
jan 1, 1978
0.0
-0.722
-100.0%
jan 1, 1979
0.435
+0.435
%
jan 1, 1980
0.001
-0.434
-99.78%
jan 1, 1981
1.634
+1.633
173.42K%
jan 1, 1982
0.2
-1.433
-87.73%
jan 1, 1983
6.453
+6.252
3.12K%
jan 1, 1984
4.309
-2.144
-33.23%
jan 1, 1985
20.099
+15.791
366.5%
jan 1, 1986
9.486
-10.613
-52.8%
jan 1, 1987
6.262
-3.224
-33.99%
jan 1, 1988
0.312
-5.95
-95.01%
jan 1, 1989
16.417
+16.105
5.16K%
jan 1, 1990
21.544
+5.126
31.23%
jan 1, 1991
8.442
-13.102
-60.82%
jan 1, 1992
7.602
-0.84
-9.95%
jan 1, 1993
1.932
-5.67
-74.58%
jan 1, 1994
5.546
+3.613
186.98%
jan 1, 1995
4.581
-0.964
-17.38%
jan 1, 1996
3.331
-1.251
-27.31%
jan 1, 1997
2.584
-0.746
-22.4%
jan 1, 1998
5.079
+2.494
96.52%
jan 1, 1999
3.063
-2.016
-39.69%
jan 1, 2000
0.871
-2.192
-71.58%
jan 1, 2001
2.772
+1.901
218.39%
jan 1, 2002
2.455
-0.317
-11.43%
jan 1, 2003
2.891
+0.436
17.77%
jan 1, 2004
3.849
+0.958
33.13%
jan 1, 2005
2.32
-1.529
-39.72%
jan 1, 2006
2.925
+0.605
26.08%
jan 1, 2007
2.475
-0.45
-15.4%
jan 1, 2008
4.25
+1.775
71.72%
jan 1, 2009
3.685
-0.564
-13.28%
jan 1, 2010
3.867
+0.182
4.93%
jan 1, 2011
1.462
-2.404
-62.18%
jan 1, 2012
0.724
-0.738
-50.46%
jan 1, 2013
0.744
+0.02
2.71%
jan 1, 2014
0.962
+0.218
29.26%
jan 1, 2015
1.044
+0.082
8.53%
Ranking of countries by current statistics by years


Comments: