29
/
en
AIzaSyAYiBZKx7MnpbEhh9jyipgxe19OcubqV5w
April 1, 2024
78517
Bangladesh
BGD
true
2
1
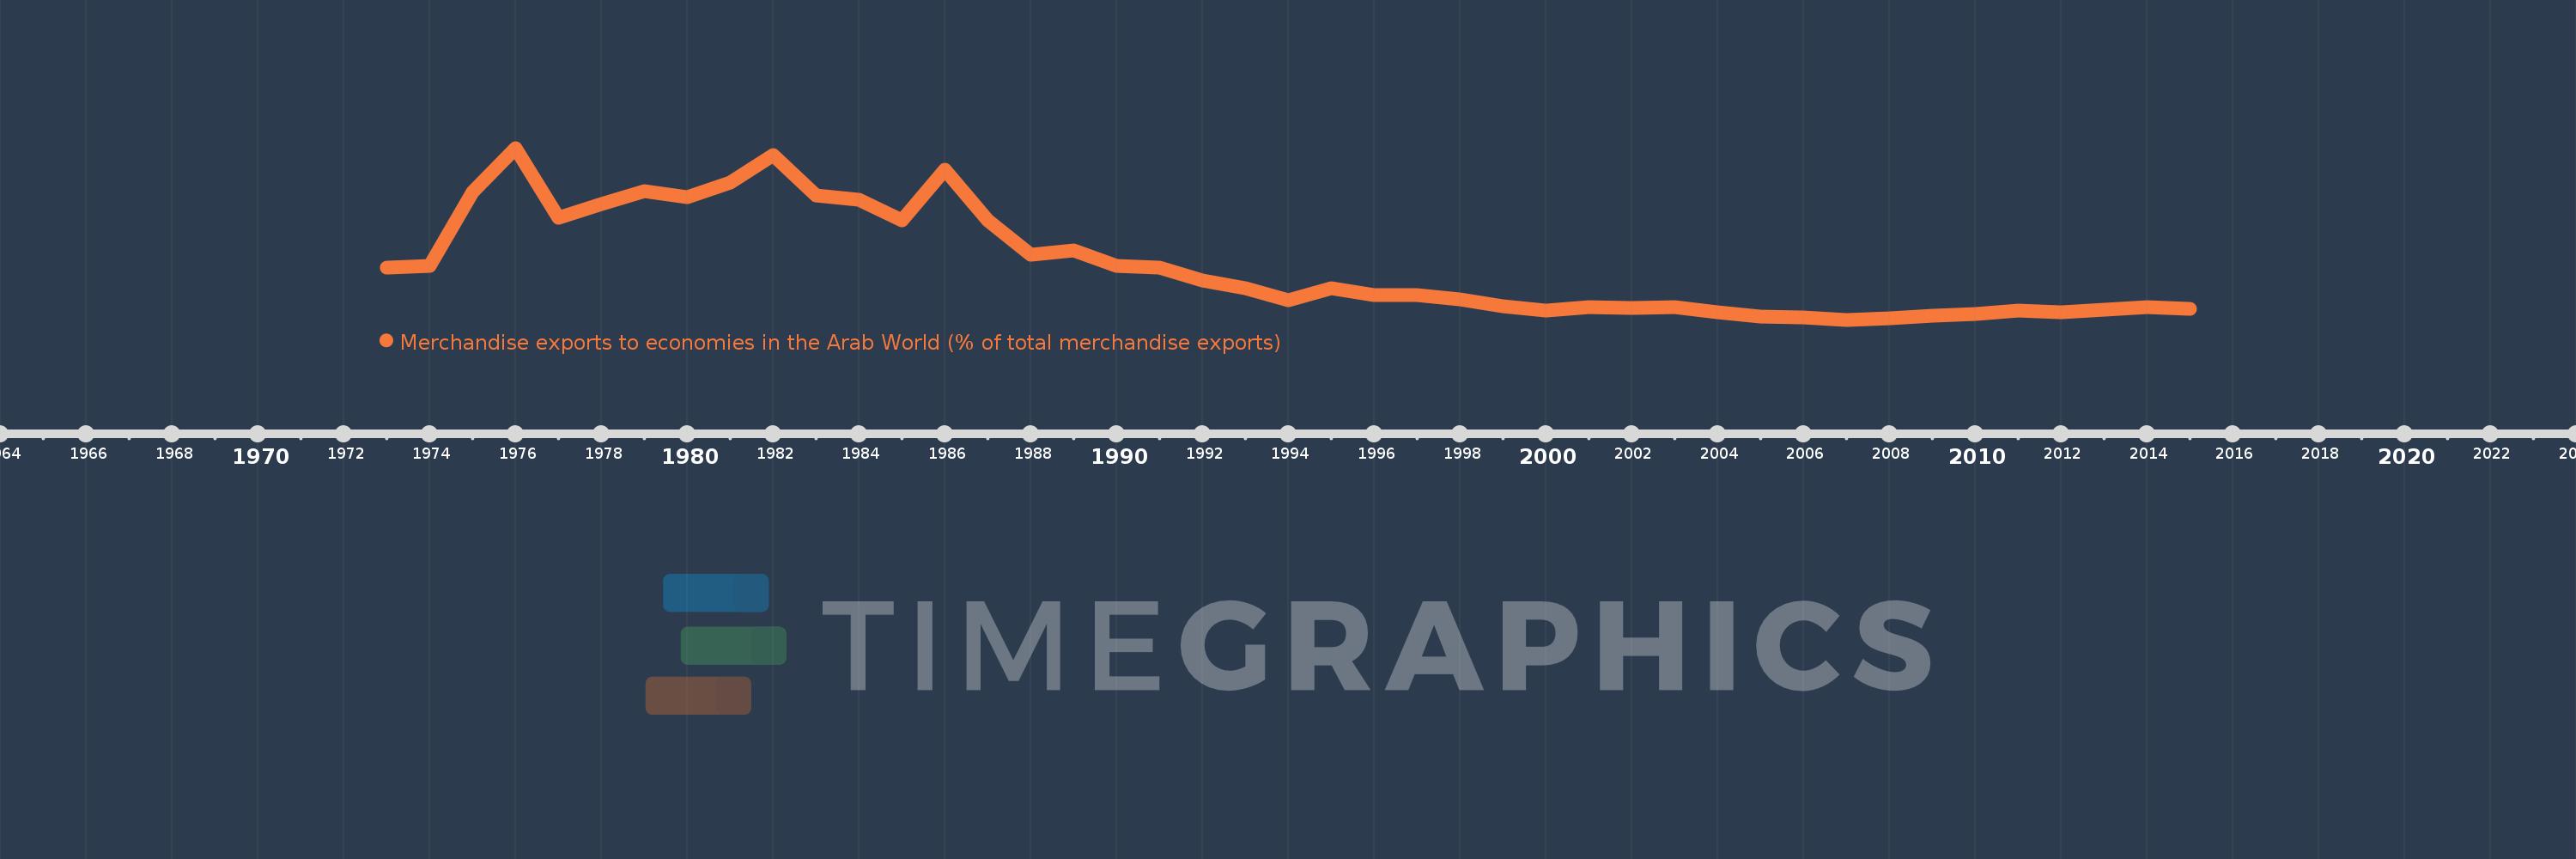
Merchandise exports to economies in the Arab World (% of total merchandise exports)
2015,2014,2013,2012,2011,2010,2009,2008,2007,2006,2005,2004,2003,2002,2001,2000,1999,1998,1997,1996,1995,1994,1993,1992,1991,1990,1989,1988,1987,1986,1985,1984,1983,1982,1981,1980,1979,1978,1977,1976,1975,1974,1973
This statistics in other country:
AfghanistanAlbaniaAlgeriaAngolaArab WorldArgentinaArmeniaArubaAustraliaAustriaAzerbaijanBahamas, TheBahrainBangladeshBarbadosBelarusBelgiumBelizeBeninBermudaBoliviaBosnia and HerzegovinaBrazilBrunei DarussalamBulgariaBurkina FasoBurundiCabo VerdeCambodiaCameroonCanadaCaribbean small statesCentral African RepublicCentral Europe and the BalticsChadChileChinaColombiaComorosCongo, Dem. Rep.Congo, Rep.Costa RicaCote d'IvoireCroatiaCubaCyprusCzech RepublicDenmarkDjiboutiDominicaDominican RepublicEarly-demographic dividendEast Asia & PacificEast Asia & Pacific (excluding high income)East Asia & Pacific (IDA & IBRD countries)EcuadorEgypt, Arab Rep.El SalvadorEstoniaEthiopiaEuro areaEurope & Central AsiaEurope & Central Asia (excluding high income)Europe & Central Asia (IDA & IBRD countries)European UnionFijiFinlandFragile and conflict affected situationsFranceGabonGambia, TheGeorgiaGermanyGhanaGreeceGreenlandGrenadaGuatemalaGuineaGuinea-BissauGuyanaHaitiHeavily indebted poor countries (HIPC)High incomeHondurasHong Kong SAR, ChinaHungaryIBRD onlyIcelandIDA & IBRD totalIDA blendIDA onlyIDA totalIndiaIndonesiaIran, Islamic Rep.IraqIrelandIsraelItalyJamaicaJapanJordanKazakhstanKenyaKorea, Dem. People’s Rep.Korea, Rep.KosovoKuwaitKyrgyz RepublicLao PDRLate-demographic dividendLatin America & Caribbean Latin America & Caribbean (excluding high income)Latin America & the Caribbean (IDA & IBRD countries)LatviaLeast developed countries: UN classificationLebanonLiberiaLibyaLithuaniaLow & middle incomeLow incomeLower middle incomeLuxembourgMacao SAR, ChinaMacedonia, FYRMadagascarMalawiMalaysiaMaldivesMaliMaltaMauritaniaMauritiusMexicoMiddle East & North AfricaMiddle East & North Africa (excluding high income)Middle East & North Africa (IDA & IBRD countries)Middle incomeMoldovaMongoliaMontenegroMoroccoMozambiqueMyanmarNepalNetherlandsNew CaledoniaNew ZealandNicaraguaNigerNigeriaNorth AmericaNorwayOECD membersOmanOther small statesPacific island small statesPakistanPanamaPapua New GuineaParaguayPeruPhilippinesPolandPortugalPost-demographic dividendPre-demographic dividendQatarRomaniaRussian FederationRwandaSamoaSaudi ArabiaSenegalSerbiaSeychellesSierra LeoneSingaporeSlovak RepublicSloveniaSmall statesSomaliaSouth AfricaSouth AsiaSouth Asia (IDA & IBRD)SpainSri LankaSt. LuciaSt. Vincent and the GrenadinesSub-Saharan Africa Sub-Saharan Africa (excluding high income)Sub-Saharan Africa (IDA & IBRD countries)SudanSurinameSwedenSwitzerlandSyrian Arab RepublicTajikistanTanzaniaThailandTogoTrinidad and TobagoTunisiaTurkeyTurkmenistanUgandaUkraineUnited Arab EmiratesUnited KingdomUnited StatesUpper middle incomeUruguayUzbekistanVenezuela, RBVietnamWorldYemen, Rep.ZambiaZimbabwe Timeline:
This timeline shows a graph from 1973 to 2015 of Bangladesh. No data until 1972. Number of actual observations by date: 43.
Source name:
World Development Indicators
Source organization:
World Bank staff estimates based data from International Monetary Fund's Direction of Trade database.
Categories, topics:
Private Sector, Trade
Last updated:
apr 23, 2017
Indicators value changes by year
Maximum:
13.956
jan 1, 1976
At the date of observation
Value
Absolute change
Change from previous value
jan 1, 1973
4.916
+4.916
0.0%
jan 1, 1974
5.077
+0.162
3.29%
jan 1, 1975
10.63
+5.552
109.35%
jan 1, 1976
13.956
+3.326
31.29%
jan 1, 1977
8.666
-5.29
-37.91%
jan 1, 1978
9.748
+1.082
12.49%
jan 1, 1979
10.691
+0.943
9.67%
jan 1, 1980
10.267
-0.424
-3.96%
jan 1, 1981
11.358
+1.091
10.63%
jan 1, 1982
13.406
+2.048
18.03%
jan 1, 1983
10.349
-3.057
-22.8%
jan 1, 1984
10.03
-0.32
-3.09%
jan 1, 1985
8.483
-1.547
-15.42%
jan 1, 1986
12.345
+3.862
45.53%
jan 1, 1987
8.503
-3.842
-31.12%
jan 1, 1988
5.909
-2.593
-30.5%
jan 1, 1989
6.257
+0.347
5.88%
jan 1, 1990
5.095
-1.162
-18.57%
jan 1, 1991
4.95
-0.145
-2.84%
jan 1, 1992
3.985
-0.965
-19.5%
jan 1, 1993
3.405
-0.58
-14.55%
jan 1, 1994
2.483
-0.922
-27.08%
jan 1, 1995
3.372
+0.89
35.83%
jan 1, 1996
2.873
-0.499
-14.81%
jan 1, 1997
2.892
+0.019
0.66%
jan 1, 1998
2.57
-0.322
-11.15%
jan 1, 1999
2.033
-0.537
-20.9%
jan 1, 2000
1.711
-0.321
-15.81%
jan 1, 2001
1.957
+0.246
14.37%
jan 1, 2002
1.911
-0.046
-2.37%
jan 1, 2003
1.968
+0.057
2.98%
jan 1, 2004
1.571
-0.397
-20.17%
jan 1, 2005
1.248
-0.323
-20.54%
jan 1, 2006
1.181
-0.067
-5.4%
jan 1, 2007
1.014
-0.167
-14.12%
jan 1, 2008
1.092
+0.077
7.63%
jan 1, 2009
1.29
+0.198
18.19%
jan 1, 2010
1.478
+0.188
14.56%
jan 1, 2011
1.738
+0.26
17.59%
jan 1, 2012
1.565
-0.173
-9.97%
jan 1, 2013
1.801
+0.236
15.09%
jan 1, 2014
1.986
+0.185
10.28%
jan 1, 2015
1.841
-0.145
-7.31%
Ranking of countries by current statistics by years


Comments: