29
/
en
AIzaSyAYiBZKx7MnpbEhh9jyipgxe19OcubqV5w
April 1, 2024
165113
Jordan
JOR
true
2
1
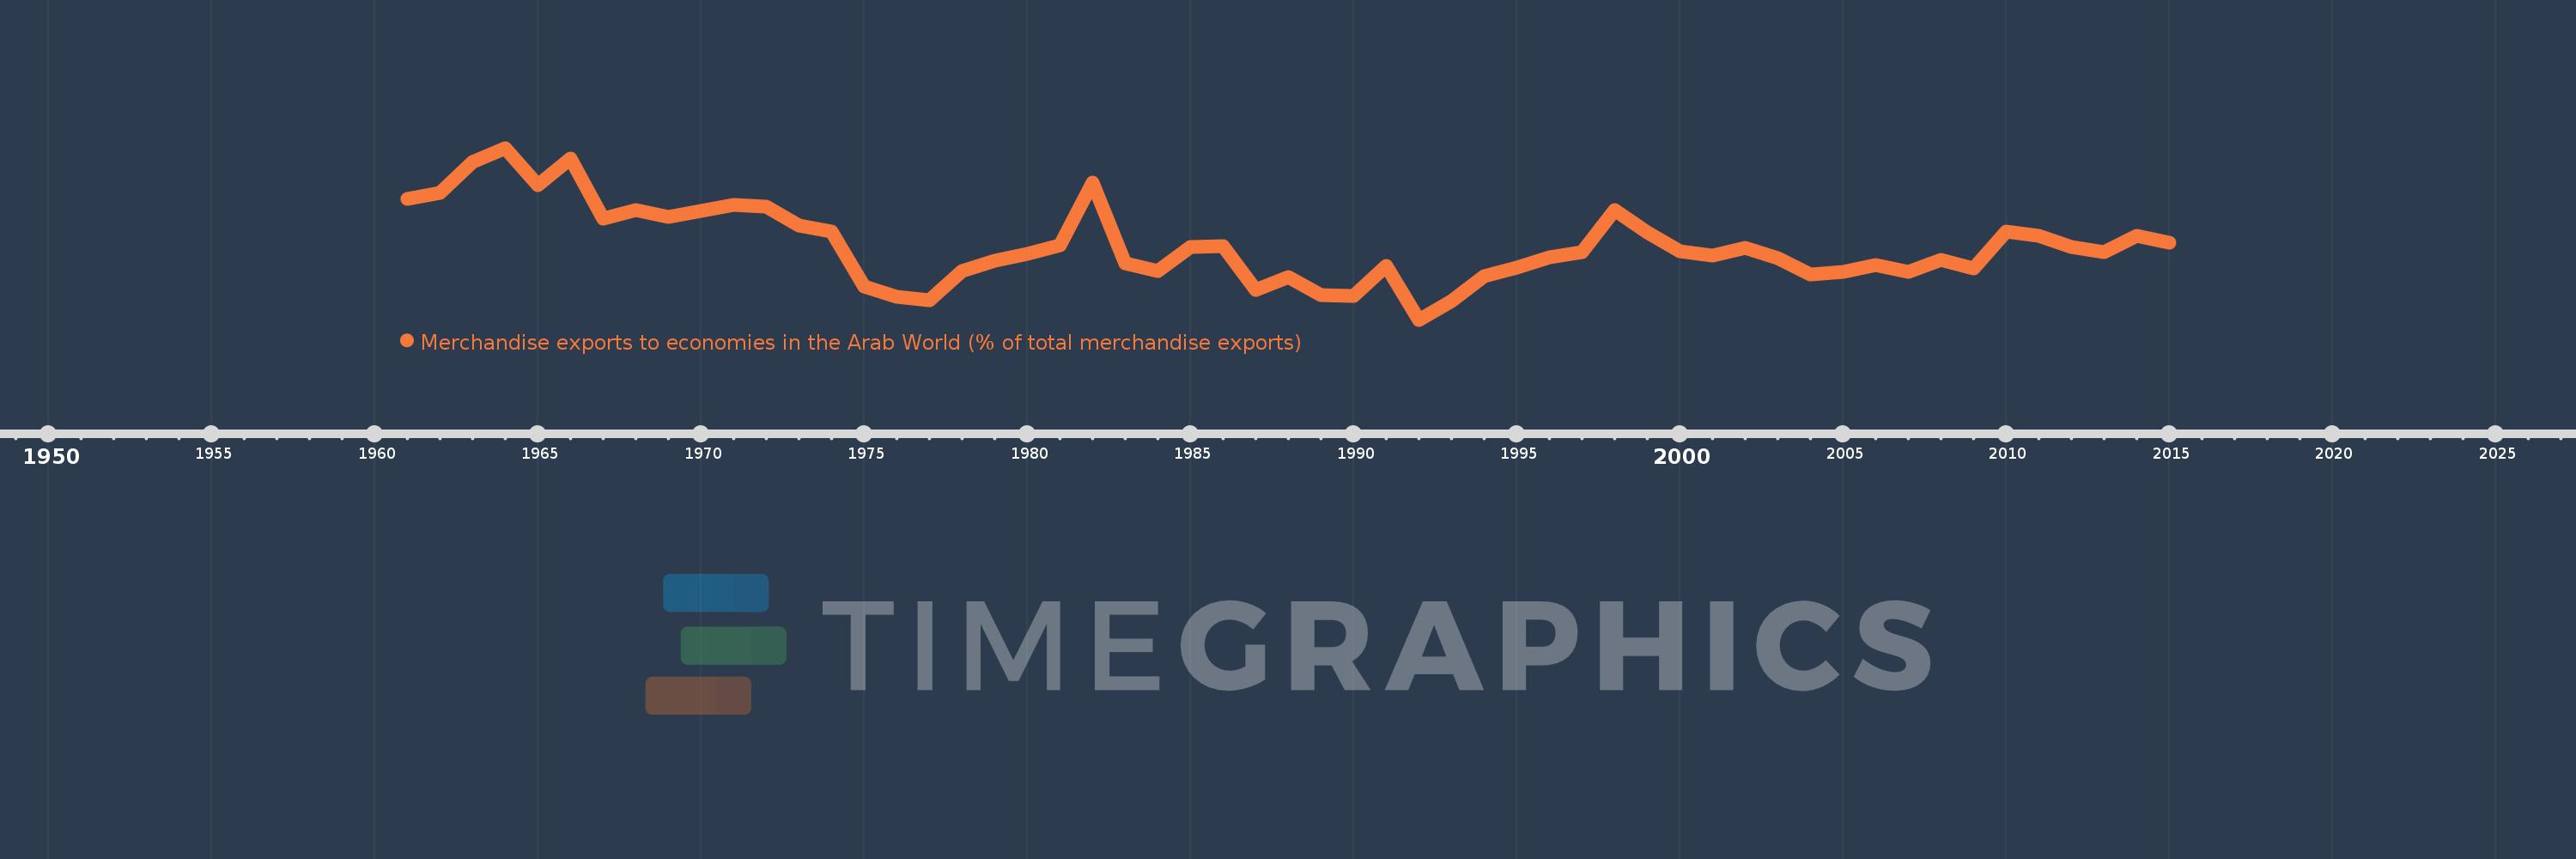
Merchandise exports to economies in the Arab World (% of total merchandise exports)
2015,2014,2013,2012,2011,2010,2009,2008,2007,2006,2005,2004,2003,2002,2001,2000,1999,1998,1997,1996,1995,1994,1993,1992,1991,1990,1989,1988,1987,1986,1985,1984,1983,1982,1981,1980,1979,1978,1977,1976,1975,1974,1973,1972,1971,1970,1969,1968,1967,1966,1965,1964,1963,1962,1961
This statistics in other country:
AfghanistanAlbaniaAlgeriaAngolaArab WorldArgentinaArmeniaArubaAustraliaAustriaAzerbaijanBahamas, TheBahrainBangladeshBarbadosBelarusBelgiumBelizeBeninBermudaBoliviaBosnia and HerzegovinaBrazilBrunei DarussalamBulgariaBurkina FasoBurundiCabo VerdeCambodiaCameroonCanadaCaribbean small statesCentral African RepublicCentral Europe and the BalticsChadChileChinaColombiaComorosCongo, Dem. Rep.Congo, Rep.Costa RicaCote d'IvoireCroatiaCubaCyprusCzech RepublicDenmarkDjiboutiDominicaDominican RepublicEarly-demographic dividendEast Asia & PacificEast Asia & Pacific (excluding high income)East Asia & Pacific (IDA & IBRD countries)EcuadorEgypt, Arab Rep.El SalvadorEstoniaEthiopiaEuro areaEurope & Central AsiaEurope & Central Asia (excluding high income)Europe & Central Asia (IDA & IBRD countries)European UnionFijiFinlandFragile and conflict affected situationsFranceGabonGambia, TheGeorgiaGermanyGhanaGreeceGreenlandGrenadaGuatemalaGuineaGuinea-BissauGuyanaHaitiHeavily indebted poor countries (HIPC)High incomeHondurasHong Kong SAR, ChinaHungaryIBRD onlyIcelandIDA & IBRD totalIDA blendIDA onlyIDA totalIndiaIndonesiaIran, Islamic Rep.IraqIrelandIsraelItalyJamaicaJapanJordanKazakhstanKenyaKorea, Dem. People’s Rep.Korea, Rep.KosovoKuwaitKyrgyz RepublicLao PDRLate-demographic dividendLatin America & Caribbean Latin America & Caribbean (excluding high income)Latin America & the Caribbean (IDA & IBRD countries)LatviaLeast developed countries: UN classificationLebanonLiberiaLibyaLithuaniaLow & middle incomeLow incomeLower middle incomeLuxembourgMacao SAR, ChinaMacedonia, FYRMadagascarMalawiMalaysiaMaldivesMaliMaltaMauritaniaMauritiusMexicoMiddle East & North AfricaMiddle East & North Africa (excluding high income)Middle East & North Africa (IDA & IBRD countries)Middle incomeMoldovaMongoliaMontenegroMoroccoMozambiqueMyanmarNepalNetherlandsNew CaledoniaNew ZealandNicaraguaNigerNigeriaNorth AmericaNorwayOECD membersOmanOther small statesPacific island small statesPakistanPanamaPapua New GuineaParaguayPeruPhilippinesPolandPortugalPost-demographic dividendPre-demographic dividendQatarRomaniaRussian FederationRwandaSamoaSaudi ArabiaSenegalSerbiaSeychellesSierra LeoneSingaporeSlovak RepublicSloveniaSmall statesSomaliaSouth AfricaSouth AsiaSouth Asia (IDA & IBRD)SpainSri LankaSt. LuciaSt. Vincent and the GrenadinesSub-Saharan Africa Sub-Saharan Africa (excluding high income)Sub-Saharan Africa (IDA & IBRD countries)SudanSurinameSwedenSwitzerlandSyrian Arab RepublicTajikistanTanzaniaThailandTogoTrinidad and TobagoTunisiaTurkeyTurkmenistanUgandaUkraineUnited Arab EmiratesUnited KingdomUnited StatesUpper middle incomeUruguayUzbekistanVenezuela, RBVietnamWorldYemen, Rep.ZambiaZimbabwe Timeline:
This timeline shows a graph from 1961 to 2015 of Jordan. No data until 1960. Number of actual observations by date: 55.
Source name:
World Development Indicators
Source organization:
World Bank staff estimates based data from International Monetary Fund's Direction of Trade database.
Categories, topics:
Private Sector, Trade
Last updated:
apr 23, 2017
Indicators value changes by year
Minimum:
27.991
jan 1, 1992
Maximum:
73.856
jan 1, 1964
At the date of observation
Value
Absolute change
Change from previous value
jan 1, 1961
60.204
+60.204
0.0%
jan 1, 1962
61.864
+1.66
2.76%
jan 1, 1963
70.073
+8.209
13.27%
jan 1, 1964
73.856
+3.783
5.4%
jan 1, 1965
63.861
-9.995
-13.53%
jan 1, 1966
71.028
+7.167
11.22%
jan 1, 1967
55.017
-16.011
-22.54%
jan 1, 1968
57.188
+2.171
3.95%
jan 1, 1969
55.385
-1.804
-3.15%
jan 1, 1970
57.047
+1.662
3.0%
jan 1, 1971
58.568
+1.521
2.67%
jan 1, 1972
58.146
-0.422
-0.72%
jan 1, 1973
53.13
-5.016
-8.63%
jan 1, 1974
51.456
-1.674
-3.15%
jan 1, 1975
36.852
-14.604
-28.38%
jan 1, 1976
34.161
-2.691
-7.3%
jan 1, 1977
33.243
-0.918
-2.69%
jan 1, 1978
40.939
+7.696
23.15%
jan 1, 1979
43.829
+2.89
7.06%
jan 1, 1980
45.64
+1.812
4.13%
jan 1, 1981
47.763
+2.122
4.65%
jan 1, 1982
64.596
+16.834
35.24%
jan 1, 1983
42.984
-21.612
-33.46%
jan 1, 1984
40.923
-2.061
-4.8%
jan 1, 1985
47.301
+6.378
15.59%
jan 1, 1986
47.596
+0.294
0.62%
jan 1, 1987
36.027
-11.568
-24.31%
jan 1, 1988
39.379
+3.352
9.3%
jan 1, 1989
34.651
-4.728
-12.01%
jan 1, 1990
34.276
-0.375
-1.08%
jan 1, 1991
42.281
+8.005
23.36%
jan 1, 1992
27.991
-14.29
-33.8%
jan 1, 1993
32.964
+4.973
17.76%
jan 1, 1994
39.595
+6.631
20.12%
jan 1, 1995
41.911
+2.316
5.85%
jan 1, 1996
44.643
+2.732
6.52%
jan 1, 1997
46.013
+1.37
3.07%
jan 1, 1998
57.31
+11.297
24.55%
jan 1, 1999
51.311
-5.999
-10.47%
jan 1, 2000
46.176
-5.135
-10.01%
jan 1, 2001
45.198
-0.978
-2.12%
jan 1, 2002
47.195
+1.997
4.42%
jan 1, 2003
44.407
-2.788
-5.91%
jan 1, 2004
40.114
-4.293
-9.67%
jan 1, 2005
40.854
+0.74
1.85%
jan 1, 2006
42.678
+1.824
4.46%
jan 1, 2007
40.73
-1.948
-4.56%
jan 1, 2008
43.935
+3.205
7.87%
jan 1, 2009
41.737
-2.198
-5.0%
jan 1, 2010
51.593
+9.856
23.61%
jan 1, 2011
50.456
-1.137
-2.2%
jan 1, 2012
47.378
-3.078
-6.1%
jan 1, 2013
46.089
-1.29
-2.72%
jan 1, 2014
50.331
+4.243
9.21%
jan 1, 2015
48.675
-1.656
-3.29%
Ranking of countries by current statistics by years


Comments: