29
/
en
AIzaSyAYiBZKx7MnpbEhh9jyipgxe19OcubqV5w
April 1, 2024
44426
Least developed countries: UN classification
LDC
false
2
1
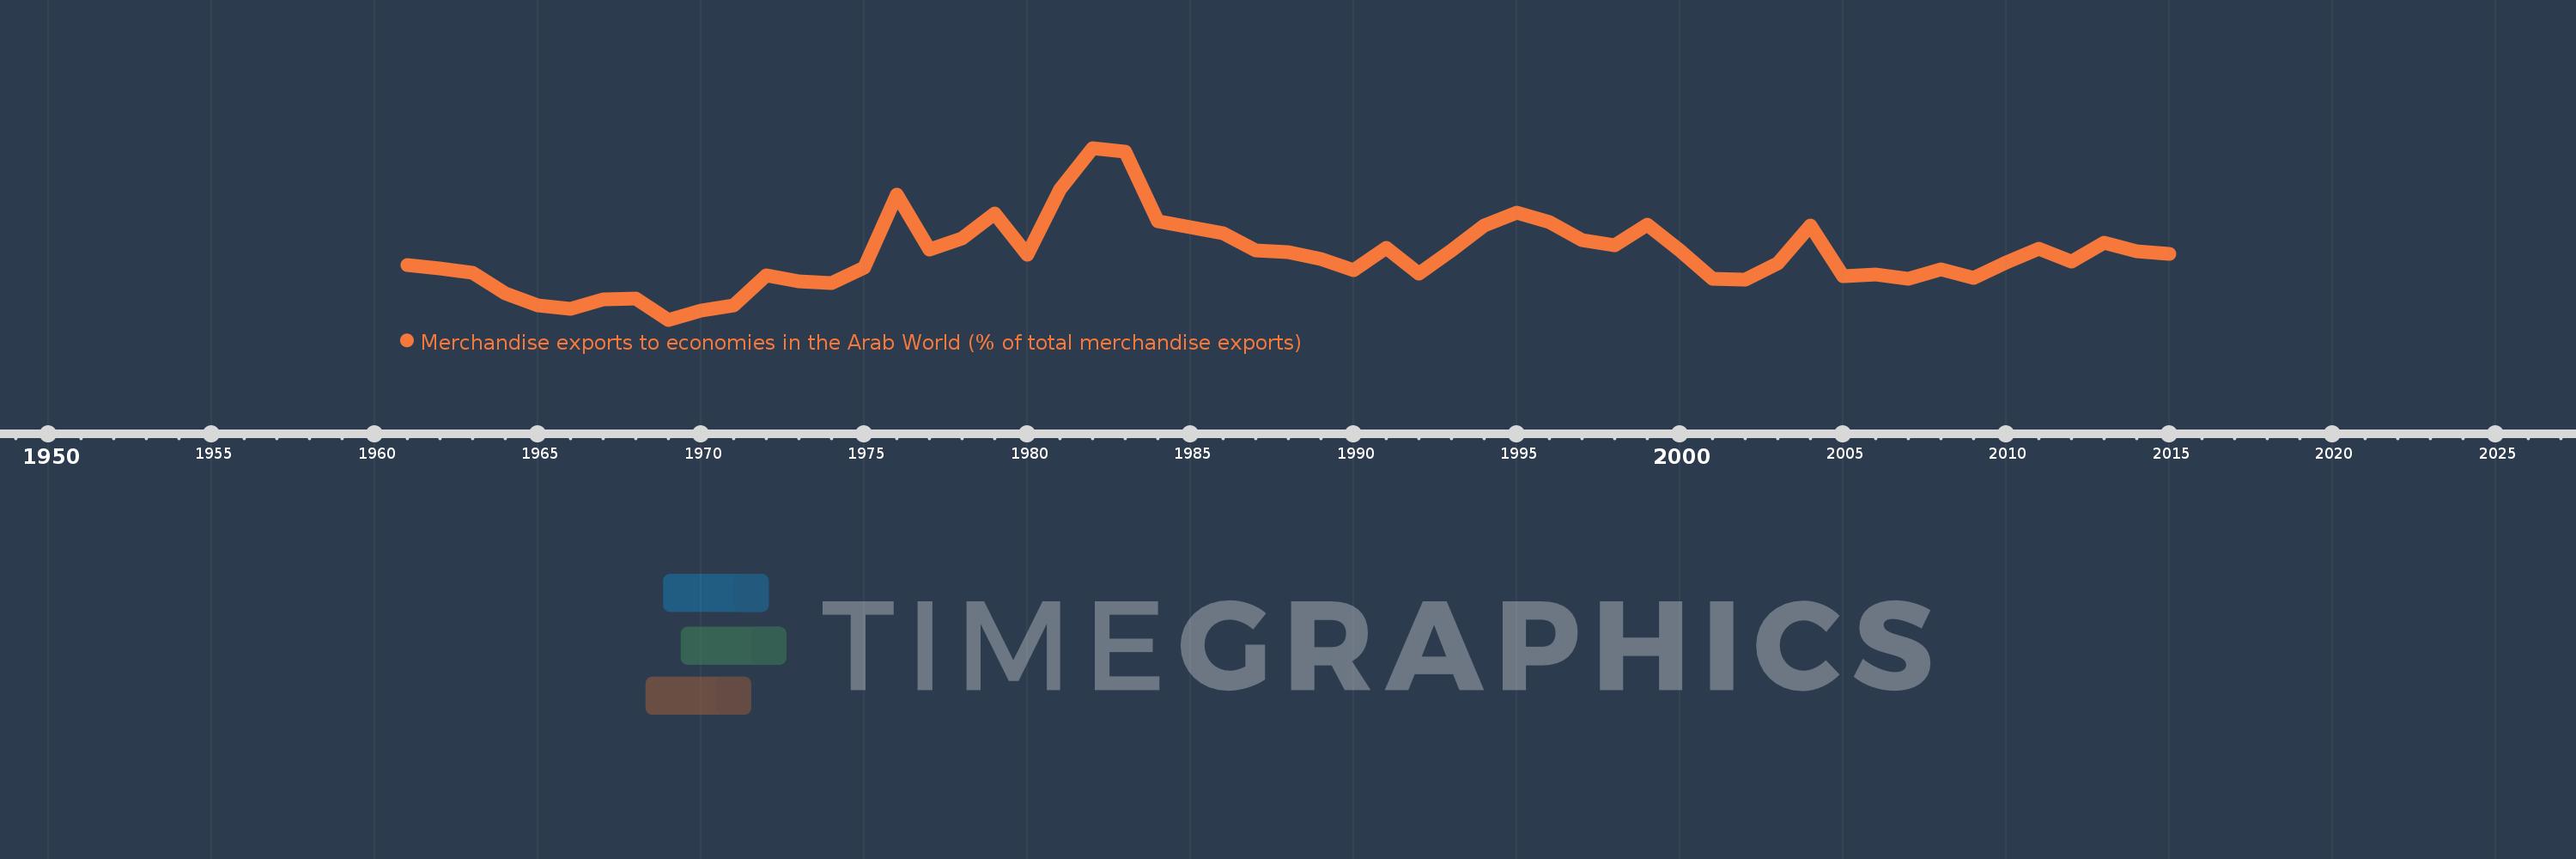
Merchandise exports to economies in the Arab World (% of total merchandise exports)
2015,2014,2013,2012,2011,2010,2009,2008,2007,2006,2005,2004,2003,2002,2001,2000,1999,1998,1997,1996,1995,1994,1993,1992,1991,1990,1989,1988,1987,1986,1985,1984,1983,1982,1981,1980,1979,1978,1977,1976,1975,1974,1973,1972,1971,1970,1969,1968,1967,1966,1965,1964,1963,1962,1961
This statistics in other country:
AfghanistanAlbaniaAlgeriaAngolaArab WorldArgentinaArmeniaArubaAustraliaAustriaAzerbaijanBahamas, TheBahrainBangladeshBarbadosBelarusBelgiumBelizeBeninBermudaBoliviaBosnia and HerzegovinaBrazilBrunei DarussalamBulgariaBurkina FasoBurundiCabo VerdeCambodiaCameroonCanadaCaribbean small statesCentral African RepublicCentral Europe and the BalticsChadChileChinaColombiaComorosCongo, Dem. Rep.Congo, Rep.Costa RicaCote d'IvoireCroatiaCubaCyprusCzech RepublicDenmarkDjiboutiDominicaDominican RepublicEarly-demographic dividendEast Asia & PacificEast Asia & Pacific (excluding high income)East Asia & Pacific (IDA & IBRD countries)EcuadorEgypt, Arab Rep.El SalvadorEstoniaEthiopiaEuro areaEurope & Central AsiaEurope & Central Asia (excluding high income)Europe & Central Asia (IDA & IBRD countries)European UnionFijiFinlandFragile and conflict affected situationsFranceGabonGambia, TheGeorgiaGermanyGhanaGreeceGreenlandGrenadaGuatemalaGuineaGuinea-BissauGuyanaHaitiHeavily indebted poor countries (HIPC)High incomeHondurasHong Kong SAR, ChinaHungaryIBRD onlyIcelandIDA & IBRD totalIDA blendIDA onlyIDA totalIndiaIndonesiaIran, Islamic Rep.IraqIrelandIsraelItalyJamaicaJapanJordanKazakhstanKenyaKorea, Dem. People’s Rep.Korea, Rep.KosovoKuwaitKyrgyz RepublicLao PDRLate-demographic dividendLatin America & Caribbean Latin America & Caribbean (excluding high income)Latin America & the Caribbean (IDA & IBRD countries)LatviaLeast developed countries: UN classificationLebanonLiberiaLibyaLithuaniaLow & middle incomeLow incomeLower middle incomeLuxembourgMacao SAR, ChinaMacedonia, FYRMadagascarMalawiMalaysiaMaldivesMaliMaltaMauritaniaMauritiusMexicoMiddle East & North AfricaMiddle East & North Africa (excluding high income)Middle East & North Africa (IDA & IBRD countries)Middle incomeMoldovaMongoliaMontenegroMoroccoMozambiqueMyanmarNepalNetherlandsNew CaledoniaNew ZealandNicaraguaNigerNigeriaNorth AmericaNorwayOECD membersOmanOther small statesPacific island small statesPakistanPanamaPapua New GuineaParaguayPeruPhilippinesPolandPortugalPost-demographic dividendPre-demographic dividendQatarRomaniaRussian FederationRwandaSamoaSaudi ArabiaSenegalSerbiaSeychellesSierra LeoneSingaporeSlovak RepublicSloveniaSmall statesSomaliaSouth AfricaSouth AsiaSouth Asia (IDA & IBRD)SpainSri LankaSt. LuciaSt. Vincent and the GrenadinesSub-Saharan Africa Sub-Saharan Africa (excluding high income)Sub-Saharan Africa (IDA & IBRD countries)SudanSurinameSwedenSwitzerlandSyrian Arab RepublicTajikistanTanzaniaThailandTogoTrinidad and TobagoTunisiaTurkeyTurkmenistanUgandaUkraineUnited Arab EmiratesUnited KingdomUnited StatesUpper middle incomeUruguayUzbekistanVenezuela, RBVietnamWorldYemen, Rep.ZambiaZimbabwe Timeline:
This timeline shows a graph from 1961 to 2015 of Least developed countries: UN classification. No data until 1960. Number of actual observations by date: 55.
Source name:
World Development Indicators
Source organization:
World Bank staff estimates based data from International Monetary Fund's Direction of Trade database.
Categories, topics:
Private Sector, Trade
Last updated:
apr 23, 2017
Indicators value changes by year
At the date of observation
Value
Absolute change
Change from previous value
jan 1, 1961
3.249
+3.249
0.0%
jan 1, 1962
3.127
-0.122
-3.75%
jan 1, 1963
2.978
-0.149
-4.77%
jan 1, 1964
2.314
-0.664
-22.31%
jan 1, 1965
1.91
-0.404
-17.47%
jan 1, 1966
1.785
-0.124
-6.5%
jan 1, 1967
2.092
+0.307
17.19%
jan 1, 1968
2.128
+0.036
1.72%
jan 1, 1969
1.431
-0.698
-32.78%
jan 1, 1970
1.748
+0.317
22.15%
jan 1, 1971
1.915
+0.167
9.56%
jan 1, 1972
2.888
+0.973
50.84%
jan 1, 1973
2.685
-0.203
-7.04%
jan 1, 1974
2.653
-0.032
-1.18%
jan 1, 1975
3.156
+0.503
18.95%
jan 1, 1976
5.562
+2.406
76.23%
jan 1, 1977
3.757
-1.805
-32.45%
jan 1, 1978
4.126
+0.37
9.84%
jan 1, 1979
4.944
+0.817
19.81%
jan 1, 1980
3.589
-1.355
-27.4%
jan 1, 1981
5.738
+2.149
59.87%
jan 1, 1982
7.104
+1.366
23.81%
jan 1, 1983
6.994
-0.11
-1.55%
jan 1, 1984
4.695
-2.299
-32.87%
jan 1, 1985
4.487
-0.208
-4.43%
jan 1, 1986
4.285
-0.202
-4.51%
jan 1, 1987
3.725
-0.56
-13.06%
jan 1, 1988
3.654
-0.071
-1.9%
jan 1, 1989
3.423
-0.231
-6.33%
jan 1, 1990
3.067
-0.356
-10.39%
jan 1, 1991
3.791
+0.723
23.59%
jan 1, 1992
2.946
-0.844
-22.27%
jan 1, 1993
3.732
+0.786
26.66%
jan 1, 1994
4.537
+0.805
21.58%
jan 1, 1995
4.956
+0.419
9.23%
jan 1, 1996
4.665
-0.291
-5.88%
jan 1, 1997
4.074
-0.59
-12.65%
jan 1, 1998
3.884
-0.19
-4.66%
jan 1, 1999
4.561
+0.677
17.43%
jan 1, 2000
3.72
-0.841
-18.44%
jan 1, 2001
2.783
-0.937
-25.19%
jan 1, 2002
2.765
-0.018
-0.66%
jan 1, 2003
3.3
+0.535
19.36%
jan 1, 2004
4.538
+1.238
37.52%
jan 1, 2005
2.867
-1.671
-36.83%
jan 1, 2006
2.916
+0.049
1.72%
jan 1, 2007
2.789
-0.127
-4.34%
jan 1, 2008
3.099
+0.309
11.08%
jan 1, 2009
2.808
-0.291
-9.39%
jan 1, 2010
3.31
+0.502
17.89%
jan 1, 2011
3.771
+0.462
13.95%
jan 1, 2012
3.356
-0.416
-11.02%
jan 1, 2013
3.964
+0.609
18.13%
jan 1, 2014
3.705
-0.259
-6.53%
jan 1, 2015
3.607
-0.098
-2.65%
Ranking of countries by current statistics by years


Comments: