29
/
en
AIzaSyAYiBZKx7MnpbEhh9jyipgxe19OcubqV5w
April 1, 2024
169332
Korea, Dem. People’s Rep.
PRK
true
2
1
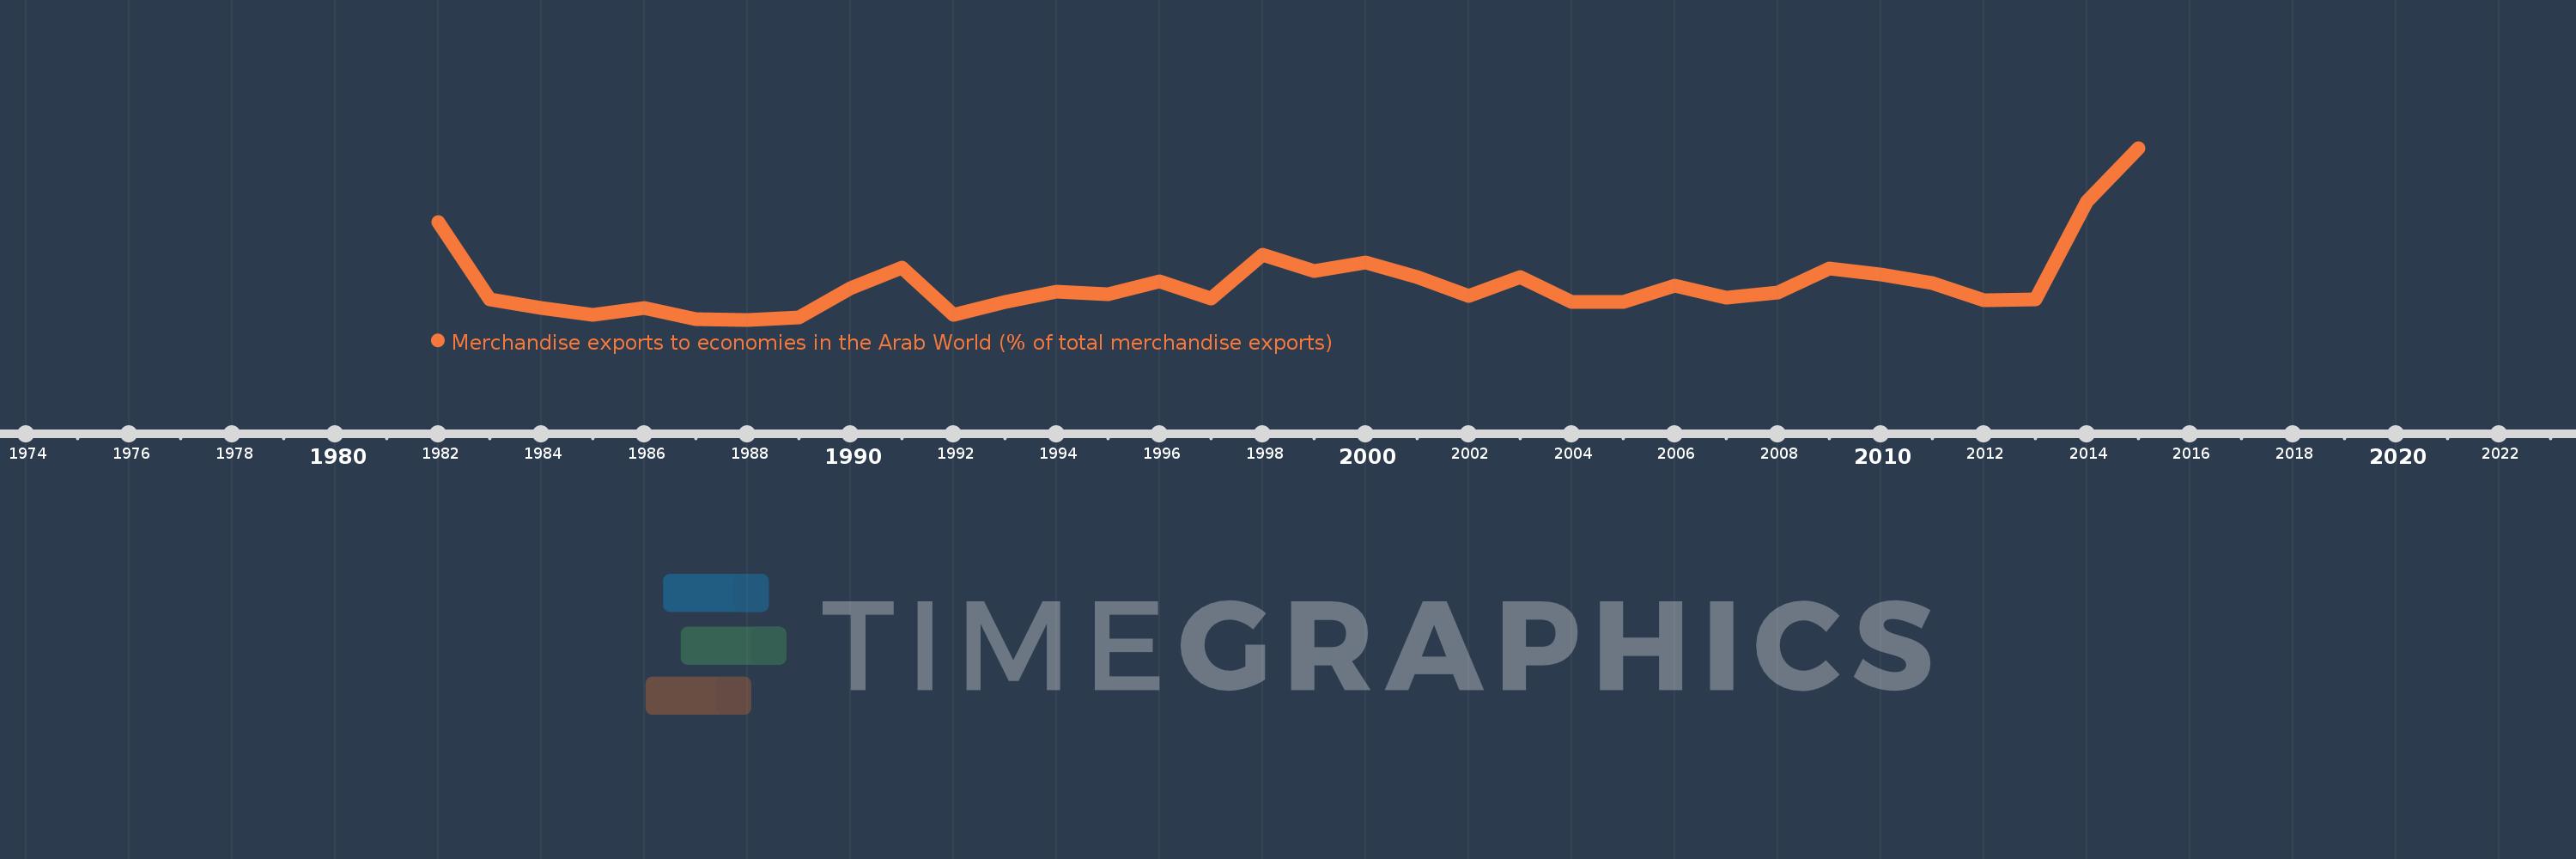
Merchandise exports to economies in the Arab World (% of total merchandise exports)
2015,2014,2013,2012,2011,2010,2009,2008,2007,2006,2005,2004,2003,2002,2001,2000,1999,1998,1997,1996,1995,1994,1993,1992,1991,1990,1989,1988,1987,1986,1985,1984,1983,1982
This statistics in other country:
AfghanistanAlbaniaAlgeriaAngolaArab WorldArgentinaArmeniaArubaAustraliaAustriaAzerbaijanBahamas, TheBahrainBangladeshBarbadosBelarusBelgiumBelizeBeninBermudaBoliviaBosnia and HerzegovinaBrazilBrunei DarussalamBulgariaBurkina FasoBurundiCabo VerdeCambodiaCameroonCanadaCaribbean small statesCentral African RepublicCentral Europe and the BalticsChadChileChinaColombiaComorosCongo, Dem. Rep.Congo, Rep.Costa RicaCote d'IvoireCroatiaCubaCyprusCzech RepublicDenmarkDjiboutiDominicaDominican RepublicEarly-demographic dividendEast Asia & PacificEast Asia & Pacific (excluding high income)East Asia & Pacific (IDA & IBRD countries)EcuadorEgypt, Arab Rep.El SalvadorEstoniaEthiopiaEuro areaEurope & Central AsiaEurope & Central Asia (excluding high income)Europe & Central Asia (IDA & IBRD countries)European UnionFijiFinlandFragile and conflict affected situationsFranceGabonGambia, TheGeorgiaGermanyGhanaGreeceGreenlandGrenadaGuatemalaGuineaGuinea-BissauGuyanaHaitiHeavily indebted poor countries (HIPC)High incomeHondurasHong Kong SAR, ChinaHungaryIBRD onlyIcelandIDA & IBRD totalIDA blendIDA onlyIDA totalIndiaIndonesiaIran, Islamic Rep.IraqIrelandIsraelItalyJamaicaJapanJordanKazakhstanKenyaKorea, Dem. People’s Rep.Korea, Rep.KosovoKuwaitKyrgyz RepublicLao PDRLate-demographic dividendLatin America & Caribbean Latin America & Caribbean (excluding high income)Latin America & the Caribbean (IDA & IBRD countries)LatviaLeast developed countries: UN classificationLebanonLiberiaLibyaLithuaniaLow & middle incomeLow incomeLower middle incomeLuxembourgMacao SAR, ChinaMacedonia, FYRMadagascarMalawiMalaysiaMaldivesMaliMaltaMauritaniaMauritiusMexicoMiddle East & North AfricaMiddle East & North Africa (excluding high income)Middle East & North Africa (IDA & IBRD countries)Middle incomeMoldovaMongoliaMontenegroMoroccoMozambiqueMyanmarNepalNetherlandsNew CaledoniaNew ZealandNicaraguaNigerNigeriaNorth AmericaNorwayOECD membersOmanOther small statesPacific island small statesPakistanPanamaPapua New GuineaParaguayPeruPhilippinesPolandPortugalPost-demographic dividendPre-demographic dividendQatarRomaniaRussian FederationRwandaSamoaSaudi ArabiaSenegalSerbiaSeychellesSierra LeoneSingaporeSlovak RepublicSloveniaSmall statesSomaliaSouth AfricaSouth AsiaSouth Asia (IDA & IBRD)SpainSri LankaSt. LuciaSt. Vincent and the GrenadinesSub-Saharan Africa Sub-Saharan Africa (excluding high income)Sub-Saharan Africa (IDA & IBRD countries)SudanSurinameSwedenSwitzerlandSyrian Arab RepublicTajikistanTanzaniaThailandTogoTrinidad and TobagoTunisiaTurkeyTurkmenistanUgandaUkraineUnited Arab EmiratesUnited KingdomUnited StatesUpper middle incomeUruguayUzbekistanVenezuela, RBVietnamWorldYemen, Rep.ZambiaZimbabwe Timeline:
This timeline shows a graph from 1982 to 2015 of Korea, Dem. People’s Rep.. No data until 1981. Number of actual observations by date: 34.
Source name:
World Development Indicators
Source organization:
World Bank staff estimates based data from International Monetary Fund's Direction of Trade database.
Categories, topics:
Private Sector, Trade
Last updated:
apr 23, 2017
Indicators value changes by year
Maximum:
32.868
jan 1, 2015
At the date of observation
Value
Absolute change
Change from previous value
jan 1, 1982
18.931
+18.931
0.0%
jan 1, 1983
4.201
-14.73
-77.81%
jan 1, 1984
2.683
-1.518
-36.14%
jan 1, 1985
1.253
-1.43
-53.29%
jan 1, 1986
2.669
+1.416
112.99%
jan 1, 1987
0.473
-2.197
-82.3%
jan 1, 1988
0.391
-0.082
-17.31%
jan 1, 1989
0.889
+0.498
127.37%
jan 1, 1990
6.335
+5.447
613.01%
jan 1, 1991
10.248
+3.912
61.76%
jan 1, 1992
1.255
-8.993
-87.76%
jan 1, 1993
3.687
+2.432
193.85%
jan 1, 1994
5.707
+2.02
54.8%
jan 1, 1995
5.201
-0.506
-8.86%
jan 1, 1996
7.65
+2.448
47.08%
jan 1, 1997
4.321
-3.329
-43.51%
jan 1, 1998
12.745
+8.424
194.96%
jan 1, 1999
9.565
-3.18
-24.95%
jan 1, 2000
11.291
+1.726
18.05%
jan 1, 2001
8.532
-2.759
-24.44%
jan 1, 2002
4.923
-3.609
-42.3%
jan 1, 2003
8.388
+3.465
70.39%
jan 1, 2004
3.73
-4.658
-55.53%
jan 1, 2005
3.694
-0.036
-0.98%
jan 1, 2006
6.798
+3.104
84.04%
jan 1, 2007
4.536
-2.261
-33.27%
jan 1, 2008
5.572
+1.036
22.83%
jan 1, 2009
10.113
+4.541
81.5%
jan 1, 2010
8.967
-1.146
-11.33%
jan 1, 2011
7.381
-1.586
-17.69%
jan 1, 2012
4.009
-3.371
-45.68%
jan 1, 2013
4.268
+0.259
6.46%
jan 1, 2014
22.696
+18.428
431.75%
jan 1, 2015
32.868
+10.172
44.82%
Ranking of countries by current statistics by years


Comments: