29
/
en
AIzaSyAYiBZKx7MnpbEhh9jyipgxe19OcubqV5w
April 1, 2024
32812
Europe & Central Asia (IDA & IBRD countries)
TEC
false
2
1
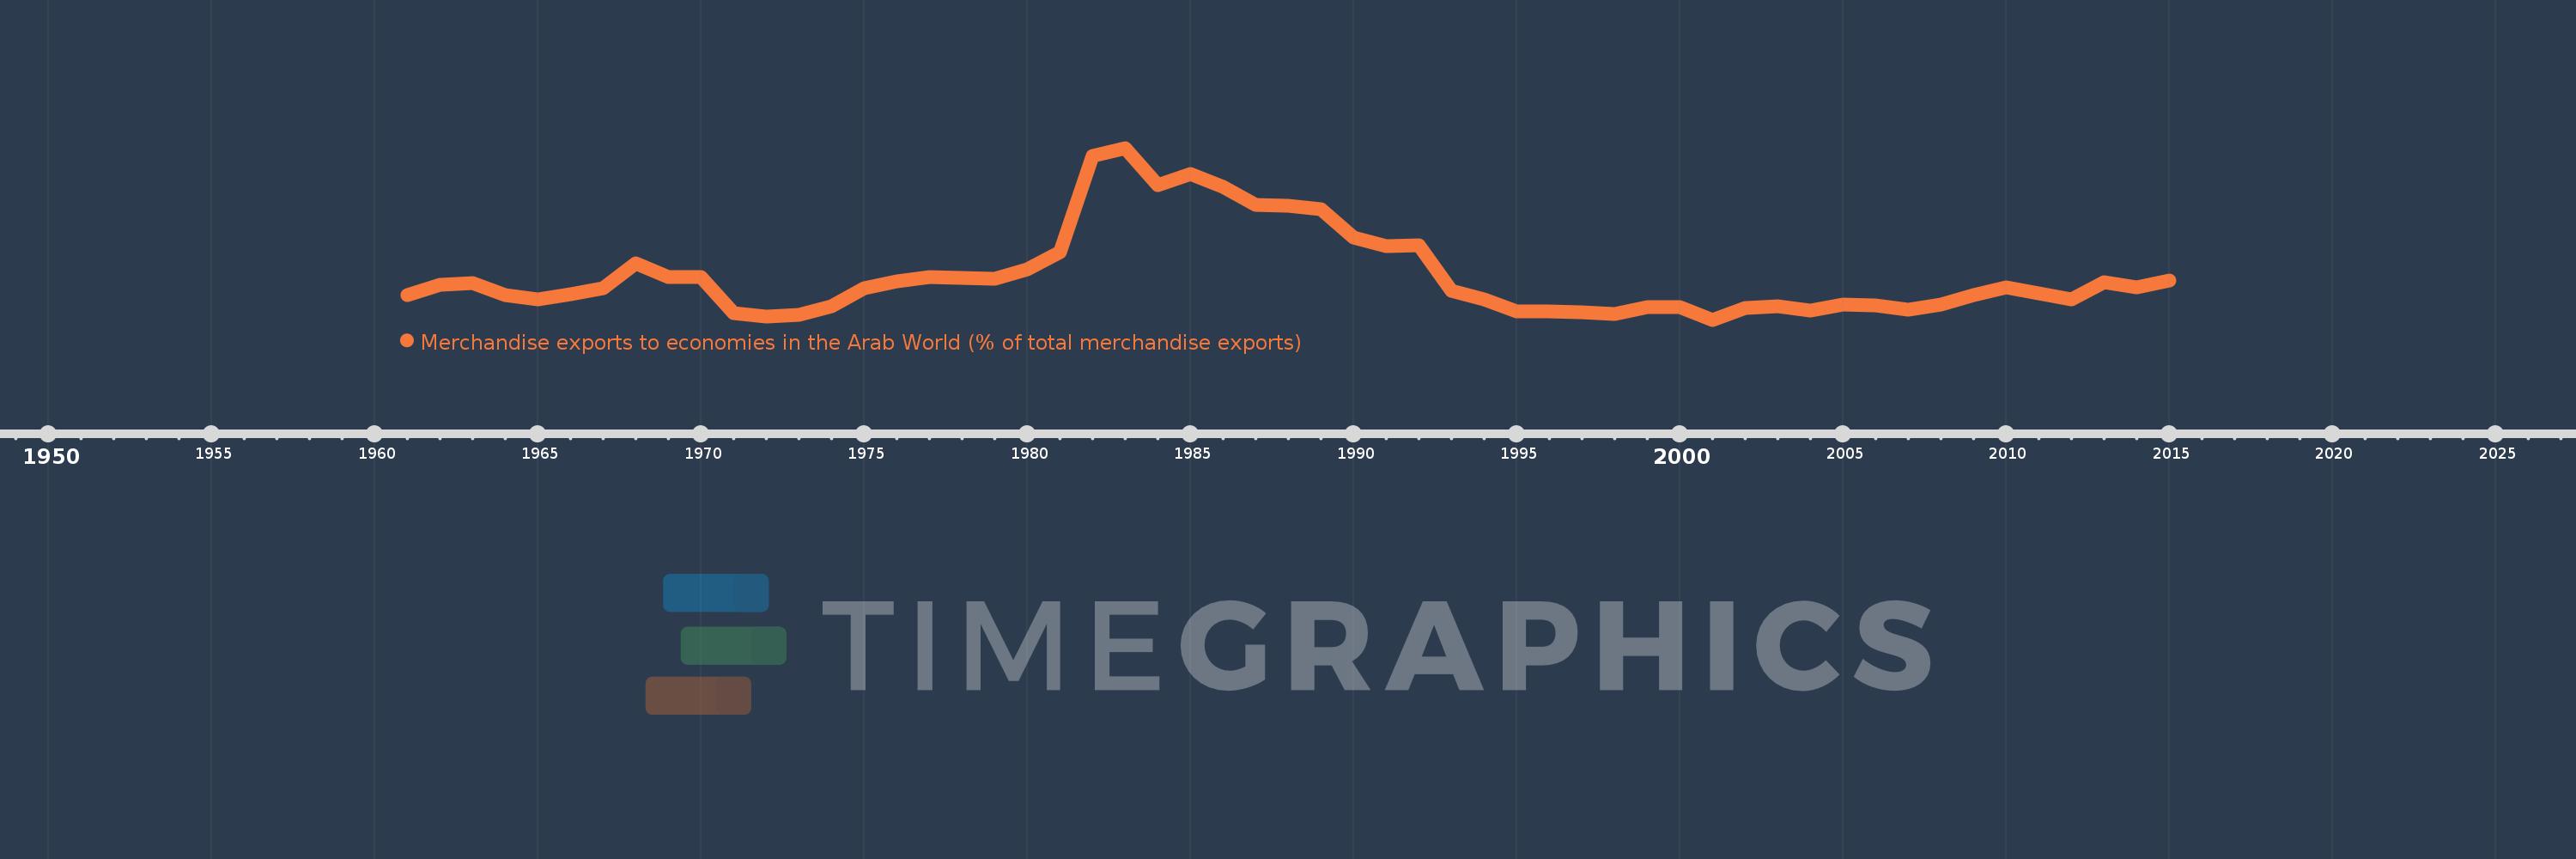
Merchandise exports to economies in the Arab World (% of total merchandise exports)
2015,2014,2013,2012,2011,2010,2009,2008,2007,2006,2005,2004,2003,2002,2001,2000,1999,1998,1997,1996,1995,1994,1993,1992,1991,1990,1989,1988,1987,1986,1985,1984,1983,1982,1981,1980,1979,1978,1977,1976,1975,1974,1973,1972,1971,1970,1969,1968,1967,1966,1965,1964,1963,1962,1961
This statistics in other country:
AfghanistanAlbaniaAlgeriaAngolaArab WorldArgentinaArmeniaArubaAustraliaAustriaAzerbaijanBahamas, TheBahrainBangladeshBarbadosBelarusBelgiumBelizeBeninBermudaBoliviaBosnia and HerzegovinaBrazilBrunei DarussalamBulgariaBurkina FasoBurundiCabo VerdeCambodiaCameroonCanadaCaribbean small statesCentral African RepublicCentral Europe and the BalticsChadChileChinaColombiaComorosCongo, Dem. Rep.Congo, Rep.Costa RicaCote d'IvoireCroatiaCubaCyprusCzech RepublicDenmarkDjiboutiDominicaDominican RepublicEarly-demographic dividendEast Asia & PacificEast Asia & Pacific (excluding high income)East Asia & Pacific (IDA & IBRD countries)EcuadorEgypt, Arab Rep.El SalvadorEstoniaEthiopiaEuro areaEurope & Central AsiaEurope & Central Asia (excluding high income)Europe & Central Asia (IDA & IBRD countries)European UnionFijiFinlandFragile and conflict affected situationsFranceGabonGambia, TheGeorgiaGermanyGhanaGreeceGreenlandGrenadaGuatemalaGuineaGuinea-BissauGuyanaHaitiHeavily indebted poor countries (HIPC)High incomeHondurasHong Kong SAR, ChinaHungaryIBRD onlyIcelandIDA & IBRD totalIDA blendIDA onlyIDA totalIndiaIndonesiaIran, Islamic Rep.IraqIrelandIsraelItalyJamaicaJapanJordanKazakhstanKenyaKorea, Dem. People’s Rep.Korea, Rep.KosovoKuwaitKyrgyz RepublicLao PDRLate-demographic dividendLatin America & Caribbean Latin America & Caribbean (excluding high income)Latin America & the Caribbean (IDA & IBRD countries)LatviaLeast developed countries: UN classificationLebanonLiberiaLibyaLithuaniaLow & middle incomeLow incomeLower middle incomeLuxembourgMacao SAR, ChinaMacedonia, FYRMadagascarMalawiMalaysiaMaldivesMaliMaltaMauritaniaMauritiusMexicoMiddle East & North AfricaMiddle East & North Africa (excluding high income)Middle East & North Africa (IDA & IBRD countries)Middle incomeMoldovaMongoliaMontenegroMoroccoMozambiqueMyanmarNepalNetherlandsNew CaledoniaNew ZealandNicaraguaNigerNigeriaNorth AmericaNorwayOECD membersOmanOther small statesPacific island small statesPakistanPanamaPapua New GuineaParaguayPeruPhilippinesPolandPortugalPost-demographic dividendPre-demographic dividendQatarRomaniaRussian FederationRwandaSamoaSaudi ArabiaSenegalSerbiaSeychellesSierra LeoneSingaporeSlovak RepublicSloveniaSmall statesSomaliaSouth AfricaSouth AsiaSouth Asia (IDA & IBRD)SpainSri LankaSt. LuciaSt. Vincent and the GrenadinesSub-Saharan Africa Sub-Saharan Africa (excluding high income)Sub-Saharan Africa (IDA & IBRD countries)SudanSurinameSwedenSwitzerlandSyrian Arab RepublicTajikistanTanzaniaThailandTogoTrinidad and TobagoTunisiaTurkeyTurkmenistanUgandaUkraineUnited Arab EmiratesUnited KingdomUnited StatesUpper middle incomeUruguayUzbekistanVenezuela, RBVietnamWorldYemen, Rep.ZambiaZimbabwe Timeline:
This timeline shows a graph from 1961 to 2015 of Europe & Central Asia (IDA & IBRD countries). No data until 1960. Number of actual observations by date: 55.
Source name:
World Development Indicators
Source organization:
World Bank staff estimates based data from International Monetary Fund's Direction of Trade database.
Categories, topics:
Private Sector, Trade
Last updated:
apr 23, 2017
Indicators value changes by year
Maximum:
15.293
jan 1, 1983
At the date of observation
Value
Absolute change
Change from previous value
jan 1, 1961
4.529
+4.529
0.0%
jan 1, 1962
5.308
+0.779
17.2%
jan 1, 1963
5.44
+0.132
2.48%
jan 1, 1964
4.519
-0.921
-16.93%
jan 1, 1965
4.241
-0.277
-6.14%
jan 1, 1966
4.605
+0.364
8.58%
jan 1, 1967
5.038
+0.433
9.41%
jan 1, 1968
6.89
+1.852
36.75%
jan 1, 1969
5.843
-1.047
-15.2%
jan 1, 1970
5.865
+0.022
0.37%
jan 1, 1971
3.253
-2.612
-44.53%
jan 1, 1972
2.981
-0.272
-8.36%
jan 1, 1973
3.112
+0.132
4.41%
jan 1, 1974
3.712
+0.6
19.28%
jan 1, 1975
5.055
+1.342
36.15%
jan 1, 1976
5.516
+0.462
9.14%
jan 1, 1977
5.842
+0.326
5.9%
jan 1, 1978
5.791
-0.051
-0.87%
jan 1, 1979
5.744
-0.047
-0.82%
jan 1, 1980
6.403
+0.659
11.47%
jan 1, 1981
7.667
+1.264
19.75%
jan 1, 1982
14.71
+7.043
91.87%
jan 1, 1983
15.293
+0.583
3.96%
jan 1, 1984
12.555
-2.738
-17.91%
jan 1, 1985
13.392
+0.837
6.66%
jan 1, 1986
12.431
-0.961
-7.17%
jan 1, 1987
11.104
-1.327
-10.67%
jan 1, 1988
11.054
-0.051
-0.46%
jan 1, 1989
10.829
-0.225
-2.04%
jan 1, 1990
8.749
-2.079
-19.2%
jan 1, 1991
8.136
-0.613
-7.01%
jan 1, 1992
8.21
+0.074
0.91%
jan 1, 1993
4.842
-3.368
-41.02%
jan 1, 1994
4.202
-0.64
-13.22%
jan 1, 1995
3.323
-0.879
-20.93%
jan 1, 1996
3.33
+0.007
0.22%
jan 1, 1997
3.294
-0.036
-1.07%
jan 1, 1998
3.176
-0.118
-3.59%
jan 1, 1999
3.642
+0.466
14.66%
jan 1, 2000
3.638
-0.003
-0.09%
jan 1, 2001
2.741
-0.897
-24.65%
jan 1, 2002
3.591
+0.85
31.01%
jan 1, 2003
3.716
+0.125
3.48%
jan 1, 2004
3.39
-0.326
-8.78%
jan 1, 2005
3.852
+0.462
13.62%
jan 1, 2006
3.803
-0.049
-1.27%
jan 1, 2007
3.48
-0.323
-8.49%
jan 1, 2008
3.859
+0.379
10.89%
jan 1, 2009
4.511
+0.652
16.91%
jan 1, 2010
5.093
+0.582
12.9%
jan 1, 2011
4.638
-0.455
-8.94%
jan 1, 2012
4.211
-0.427
-9.2%
jan 1, 2013
5.478
+1.267
30.07%
jan 1, 2014
5.106
-0.372
-6.79%
jan 1, 2015
5.622
+0.516
10.1%
Ranking of countries by current statistics by years


Comments: