29
/
en
AIzaSyAYiBZKx7MnpbEhh9jyipgxe19OcubqV5w
April 1, 2024
122412
Dominican Republic
DOM
true
2
1
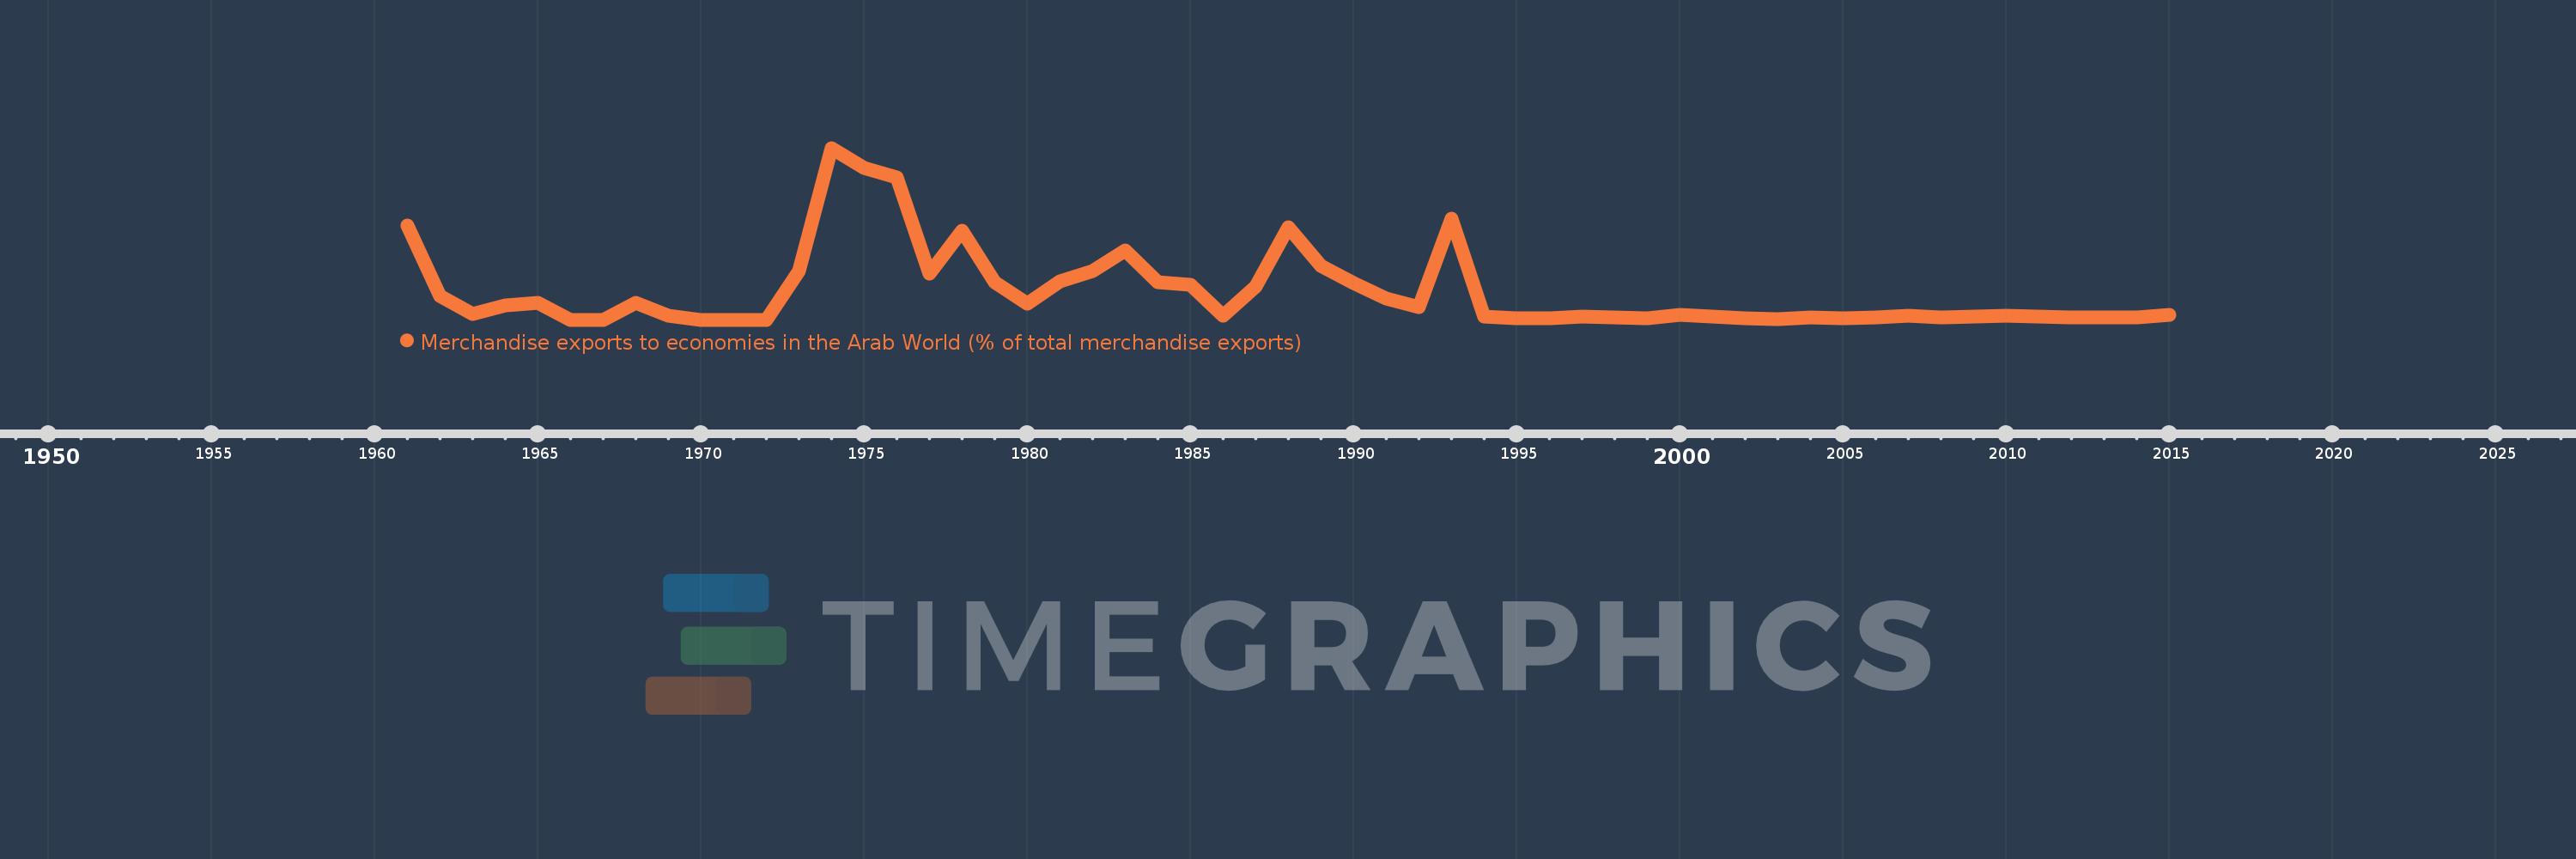
Merchandise exports to economies in the Arab World (% of total merchandise exports)
2015,2014,2013,2012,2011,2010,2009,2008,2007,2006,2005,2004,2003,2002,2001,2000,1999,1998,1997,1996,1995,1994,1993,1992,1991,1990,1989,1988,1987,1986,1985,1984,1983,1982,1981,1980,1979,1978,1977,1976,1975,1974,1973,1972,1971,1970,1969,1968,1967,1966,1965,1964,1963,1962,1961
This statistics in other country:
AfghanistanAlbaniaAlgeriaAngolaArab WorldArgentinaArmeniaArubaAustraliaAustriaAzerbaijanBahamas, TheBahrainBangladeshBarbadosBelarusBelgiumBelizeBeninBermudaBoliviaBosnia and HerzegovinaBrazilBrunei DarussalamBulgariaBurkina FasoBurundiCabo VerdeCambodiaCameroonCanadaCaribbean small statesCentral African RepublicCentral Europe and the BalticsChadChileChinaColombiaComorosCongo, Dem. Rep.Congo, Rep.Costa RicaCote d'IvoireCroatiaCubaCyprusCzech RepublicDenmarkDjiboutiDominicaDominican RepublicEarly-demographic dividendEast Asia & PacificEast Asia & Pacific (excluding high income)East Asia & Pacific (IDA & IBRD countries)EcuadorEgypt, Arab Rep.El SalvadorEstoniaEthiopiaEuro areaEurope & Central AsiaEurope & Central Asia (excluding high income)Europe & Central Asia (IDA & IBRD countries)European UnionFijiFinlandFragile and conflict affected situationsFranceGabonGambia, TheGeorgiaGermanyGhanaGreeceGreenlandGrenadaGuatemalaGuineaGuinea-BissauGuyanaHaitiHeavily indebted poor countries (HIPC)High incomeHondurasHong Kong SAR, ChinaHungaryIBRD onlyIcelandIDA & IBRD totalIDA blendIDA onlyIDA totalIndiaIndonesiaIran, Islamic Rep.IraqIrelandIsraelItalyJamaicaJapanJordanKazakhstanKenyaKorea, Dem. People’s Rep.Korea, Rep.KosovoKuwaitKyrgyz RepublicLao PDRLate-demographic dividendLatin America & Caribbean Latin America & Caribbean (excluding high income)Latin America & the Caribbean (IDA & IBRD countries)LatviaLeast developed countries: UN classificationLebanonLiberiaLibyaLithuaniaLow & middle incomeLow incomeLower middle incomeLuxembourgMacao SAR, ChinaMacedonia, FYRMadagascarMalawiMalaysiaMaldivesMaliMaltaMauritaniaMauritiusMexicoMiddle East & North AfricaMiddle East & North Africa (excluding high income)Middle East & North Africa (IDA & IBRD countries)Middle incomeMoldovaMongoliaMontenegroMoroccoMozambiqueMyanmarNepalNetherlandsNew CaledoniaNew ZealandNicaraguaNigerNigeriaNorth AmericaNorwayOECD membersOmanOther small statesPacific island small statesPakistanPanamaPapua New GuineaParaguayPeruPhilippinesPolandPortugalPost-demographic dividendPre-demographic dividendQatarRomaniaRussian FederationRwandaSamoaSaudi ArabiaSenegalSerbiaSeychellesSierra LeoneSingaporeSlovak RepublicSloveniaSmall statesSomaliaSouth AfricaSouth AsiaSouth Asia (IDA & IBRD)SpainSri LankaSt. LuciaSt. Vincent and the GrenadinesSub-Saharan Africa Sub-Saharan Africa (excluding high income)Sub-Saharan Africa (IDA & IBRD countries)SudanSurinameSwedenSwitzerlandSyrian Arab RepublicTajikistanTanzaniaThailandTogoTrinidad and TobagoTunisiaTurkeyTurkmenistanUgandaUkraineUnited Arab EmiratesUnited KingdomUnited StatesUpper middle incomeUruguayUzbekistanVenezuela, RBVietnamWorldYemen, Rep.ZambiaZimbabwe Timeline:
This timeline shows a graph from 1961 to 2015 of Dominican Republic. No data until 1960. Number of actual observations by date: 55.
Source name:
World Development Indicators
Source organization:
World Bank staff estimates based data from International Monetary Fund's Direction of Trade database.
Categories, topics:
Private Sector, Trade
Last updated:
apr 23, 2017
Indicators value changes by year
At the date of observation
Value
Absolute change
Change from previous value
jan 1, 1961
2.22
+2.22
0.0%
jan 1, 1962
0.564
-1.656
-74.58%
jan 1, 1963
0.139
-0.425
-75.38%
jan 1, 1964
0.343
+0.205
147.34%
jan 1, 1965
0.396
+0.052
15.24%
jan 1, 1966
0.0
-0.396
-100.0%
jan 1, 1968
0.402
+0.402
%
jan 1, 1969
0.085
-0.317
-78.86%
jan 1, 1970
0.0
-0.085
-100.0%
jan 1, 1973
1.151
+1.151
%
jan 1, 1974
4.033
+2.882
250.29%
jan 1, 1975
3.57
-0.463
-11.47%
jan 1, 1976
3.351
-0.22
-6.15%
jan 1, 1977
1.075
-2.275
-67.91%
jan 1, 1978
2.09
+1.015
94.38%
jan 1, 1979
0.879
-1.211
-57.94%
jan 1, 1980
0.375
-0.504
-57.35%
jan 1, 1981
0.906
+0.531
141.73%
jan 1, 1982
1.151
+0.245
27.05%
jan 1, 1983
1.628
+0.476
41.37%
jan 1, 1984
0.887
-0.741
-45.5%
jan 1, 1985
0.812
-0.076
-8.53%
jan 1, 1986
0.098
-0.714
-87.96%
jan 1, 1987
0.789
+0.692
707.8%
jan 1, 1988
2.174
+1.385
175.47%
jan 1, 1989
1.266
-0.909
-41.79%
jan 1, 1990
0.866
-0.4
-31.61%
jan 1, 1991
0.491
-0.374
-43.24%
jan 1, 1992
0.303
-0.188
-38.29%
jan 1, 1993
2.382
+2.079
685.77%
jan 1, 1994
0.077
-2.305
-96.75%
jan 1, 1995
0.027
-0.051
-65.52%
jan 1, 1996
0.039
+0.012
45.51%
jan 1, 1997
0.07
+0.031
79.18%
jan 1, 1998
0.049
-0.021
-30.16%
jan 1, 1999
0.034
-0.014
-29.27%
jan 1, 2000
0.12
+0.086
249.86%
jan 1, 2001
0.073
-0.048
-39.64%
jan 1, 2002
0.028
-0.045
-61.26%
jan 1, 2003
0.008
-0.02
-72.27%
jan 1, 2004
0.046
+0.038
486.77%
jan 1, 2005
0.04
-0.005
-11.82%
jan 1, 2006
0.051
+0.01
25.46%
jan 1, 2007
0.086
+0.035
69.66%
jan 1, 2008
0.056
-0.03
-34.45%
jan 1, 2009
0.065
+0.009
15.29%
jan 1, 2010
0.088
+0.023
36.0%
jan 1, 2011
0.079
-0.009
-10.35%
jan 1, 2012
0.051
-0.029
-36.18%
jan 1, 2013
0.057
+0.007
13.53%
jan 1, 2014
0.06
+0.003
4.97%
jan 1, 2015
0.115
+0.055
91.29%
Ranking of countries by current statistics by years


Comments: