29
/
en
AIzaSyAYiBZKx7MnpbEhh9jyipgxe19OcubqV5w
April 1, 2024
113856
Cote d'Ivoire
CIV
true
2
1
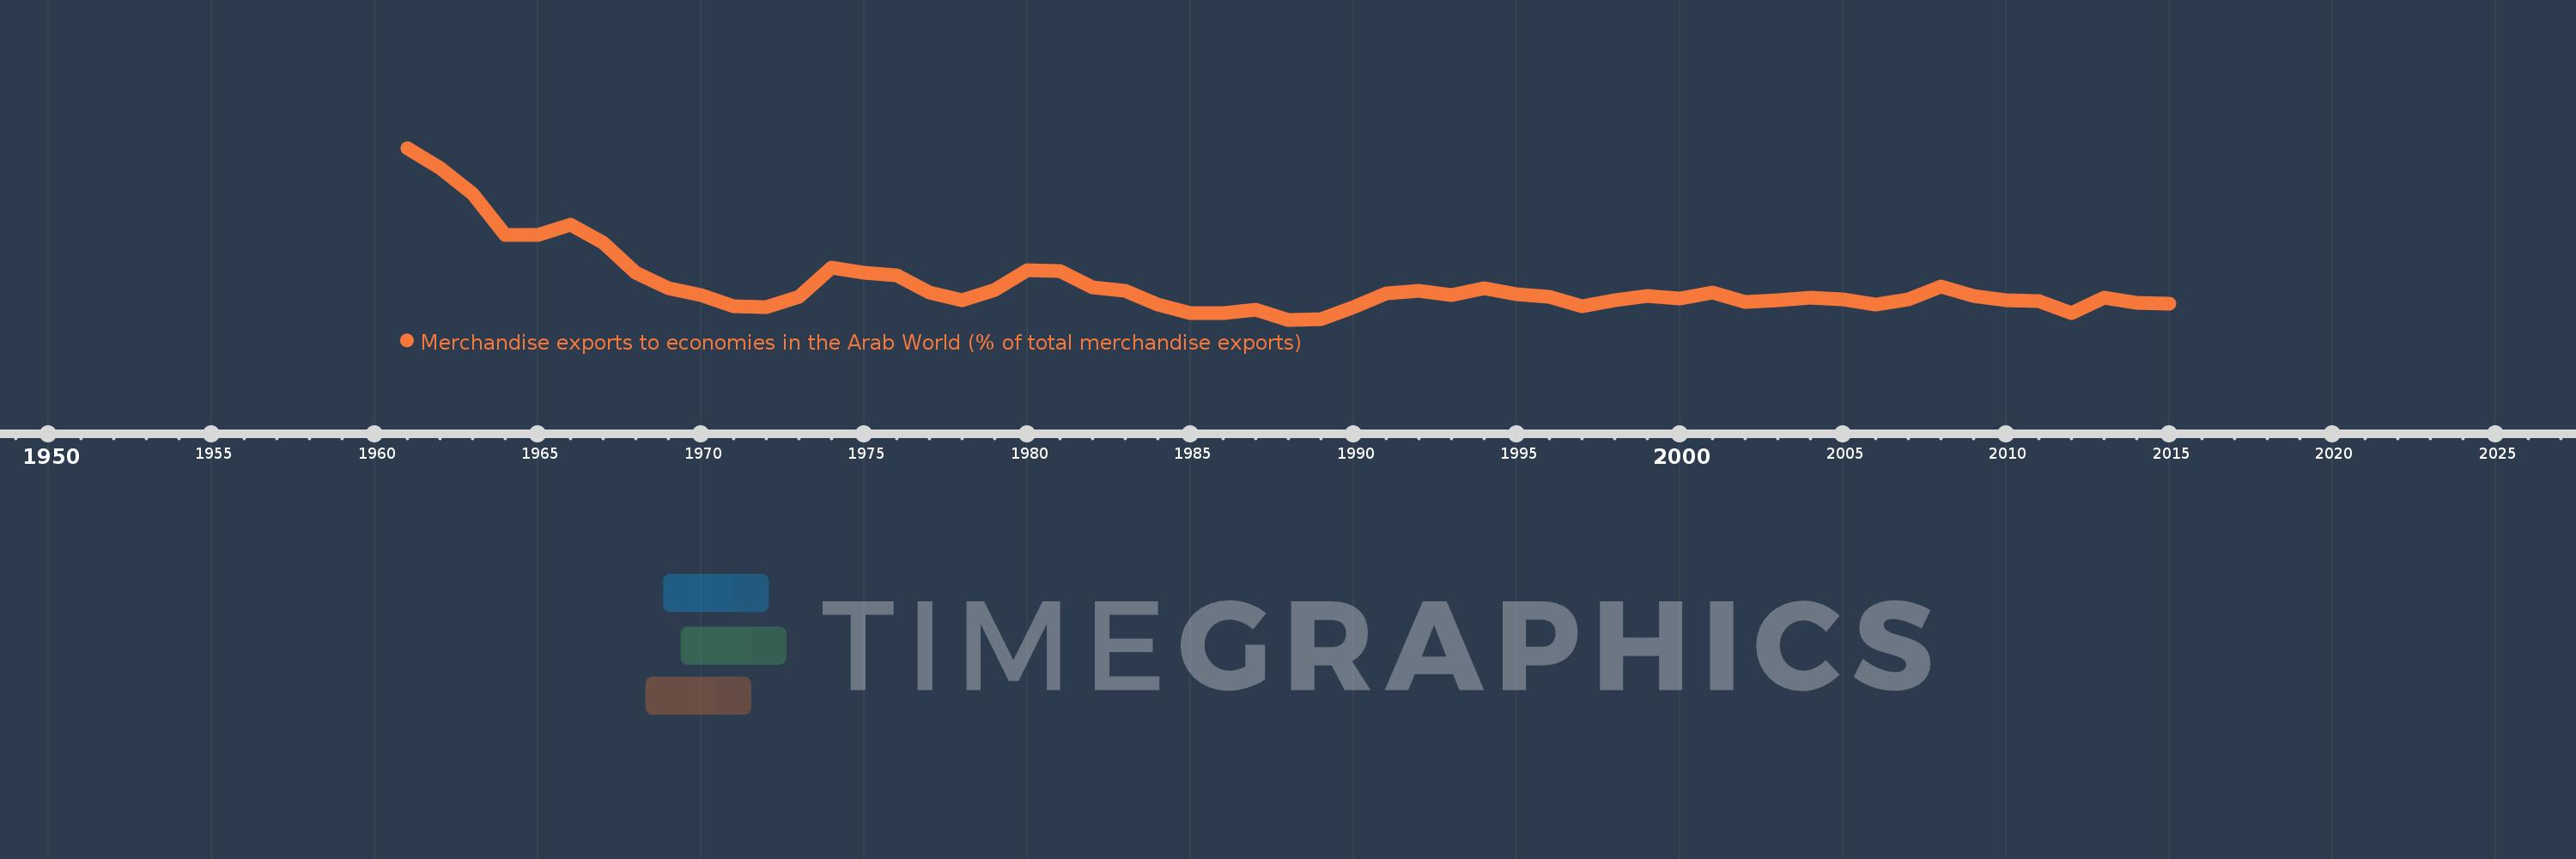
Merchandise exports to economies in the Arab World (% of total merchandise exports)
2015,2014,2013,2012,2011,2010,2009,2008,2007,2006,2005,2004,2003,2002,2001,2000,1999,1998,1997,1996,1995,1994,1993,1992,1991,1990,1989,1988,1987,1986,1985,1984,1983,1982,1981,1980,1979,1978,1977,1976,1975,1974,1973,1972,1971,1970,1969,1968,1967,1966,1965,1964,1963,1962,1961
This statistics in other country:
AfghanistanAlbaniaAlgeriaAngolaArab WorldArgentinaArmeniaArubaAustraliaAustriaAzerbaijanBahamas, TheBahrainBangladeshBarbadosBelarusBelgiumBelizeBeninBermudaBoliviaBosnia and HerzegovinaBrazilBrunei DarussalamBulgariaBurkina FasoBurundiCabo VerdeCambodiaCameroonCanadaCaribbean small statesCentral African RepublicCentral Europe and the BalticsChadChileChinaColombiaComorosCongo, Dem. Rep.Congo, Rep.Costa RicaCote d'IvoireCroatiaCubaCyprusCzech RepublicDenmarkDjiboutiDominicaDominican RepublicEarly-demographic dividendEast Asia & PacificEast Asia & Pacific (excluding high income)East Asia & Pacific (IDA & IBRD countries)EcuadorEgypt, Arab Rep.El SalvadorEstoniaEthiopiaEuro areaEurope & Central AsiaEurope & Central Asia (excluding high income)Europe & Central Asia (IDA & IBRD countries)European UnionFijiFinlandFragile and conflict affected situationsFranceGabonGambia, TheGeorgiaGermanyGhanaGreeceGreenlandGrenadaGuatemalaGuineaGuinea-BissauGuyanaHaitiHeavily indebted poor countries (HIPC)High incomeHondurasHong Kong SAR, ChinaHungaryIBRD onlyIcelandIDA & IBRD totalIDA blendIDA onlyIDA totalIndiaIndonesiaIran, Islamic Rep.IraqIrelandIsraelItalyJamaicaJapanJordanKazakhstanKenyaKorea, Dem. People’s Rep.Korea, Rep.KosovoKuwaitKyrgyz RepublicLao PDRLate-demographic dividendLatin America & Caribbean Latin America & Caribbean (excluding high income)Latin America & the Caribbean (IDA & IBRD countries)LatviaLeast developed countries: UN classificationLebanonLiberiaLibyaLithuaniaLow & middle incomeLow incomeLower middle incomeLuxembourgMacao SAR, ChinaMacedonia, FYRMadagascarMalawiMalaysiaMaldivesMaliMaltaMauritaniaMauritiusMexicoMiddle East & North AfricaMiddle East & North Africa (excluding high income)Middle East & North Africa (IDA & IBRD countries)Middle incomeMoldovaMongoliaMontenegroMoroccoMozambiqueMyanmarNepalNetherlandsNew CaledoniaNew ZealandNicaraguaNigerNigeriaNorth AmericaNorwayOECD membersOmanOther small statesPacific island small statesPakistanPanamaPapua New GuineaParaguayPeruPhilippinesPolandPortugalPost-demographic dividendPre-demographic dividendQatarRomaniaRussian FederationRwandaSamoaSaudi ArabiaSenegalSerbiaSeychellesSierra LeoneSingaporeSlovak RepublicSloveniaSmall statesSomaliaSouth AfricaSouth AsiaSouth Asia (IDA & IBRD)SpainSri LankaSt. LuciaSt. Vincent and the GrenadinesSub-Saharan Africa Sub-Saharan Africa (excluding high income)Sub-Saharan Africa (IDA & IBRD countries)SudanSurinameSwedenSwitzerlandSyrian Arab RepublicTajikistanTanzaniaThailandTogoTrinidad and TobagoTunisiaTurkeyTurkmenistanUgandaUkraineUnited Arab EmiratesUnited KingdomUnited StatesUpper middle incomeUruguayUzbekistanVenezuela, RBVietnamWorldYemen, Rep.ZambiaZimbabwe Timeline:
This timeline shows a graph from 1961 to 2015 of Cote d'Ivoire. No data until 1960. Number of actual observations by date: 55.
Source name:
World Development Indicators
Source organization:
World Bank staff estimates based data from International Monetary Fund's Direction of Trade database.
Categories, topics:
Private Sector, Trade
Last updated:
apr 23, 2017
Indicators value changes by year
Maximum:
11.191
jan 1, 1961
At the date of observation
Value
Absolute change
Change from previous value
jan 1, 1961
11.191
+11.191
0.0%
jan 1, 1962
9.949
-1.242
-11.1%
jan 1, 1963
8.286
-1.664
-16.72%
jan 1, 1964
5.734
-2.552
-30.8%
jan 1, 1965
5.736
+0.002
0.03%
jan 1, 1966
6.354
+0.618
10.77%
jan 1, 1967
5.214
-1.14
-17.94%
jan 1, 1968
3.33
-1.884
-36.13%
jan 1, 1969
2.367
-0.964
-28.93%
jan 1, 1970
1.904
-0.463
-19.54%
jan 1, 1971
1.23
-0.674
-35.39%
jan 1, 1972
1.185
-0.046
-3.71%
jan 1, 1973
1.838
+0.654
55.17%
jan 1, 1974
3.658
+1.82
99.01%
jan 1, 1975
3.335
-0.323
-8.83%
jan 1, 1976
3.15
-0.186
-5.56%
jan 1, 1977
2.118
-1.032
-32.77%
jan 1, 1978
1.592
-0.526
-24.83%
jan 1, 1979
2.27
+0.678
42.6%
jan 1, 1980
3.489
+1.219
53.71%
jan 1, 1981
3.468
-0.021
-0.61%
jan 1, 1982
2.419
-1.049
-30.24%
jan 1, 1983
2.176
-0.243
-10.04%
jan 1, 1984
1.341
-0.835
-38.36%
jan 1, 1985
0.786
-0.555
-41.41%
jan 1, 1986
0.776
-0.01
-1.33%
jan 1, 1987
1.016
+0.241
31.03%
jan 1, 1988
0.379
-0.637
-62.72%
jan 1, 1989
0.414
+0.036
9.39%
jan 1, 1990
1.156
+0.742
179.03%
jan 1, 1991
2.05
+0.893
77.24%
jan 1, 1992
2.197
+0.148
7.2%
jan 1, 1993
1.941
-0.256
-11.63%
jan 1, 1994
2.352
+0.411
21.16%
jan 1, 1995
2.009
-0.343
-14.6%
jan 1, 1996
1.838
-0.171
-8.53%
jan 1, 1997
1.252
-0.585
-31.84%
jan 1, 1998
1.584
+0.332
26.51%
jan 1, 1999
1.86
+0.276
17.41%
jan 1, 2000
1.707
-0.154
-8.25%
jan 1, 2001
2.077
+0.37
21.69%
jan 1, 2002
1.513
-0.564
-27.16%
jan 1, 2003
1.584
+0.072
4.73%
jan 1, 2004
1.786
+0.202
12.75%
jan 1, 2005
1.654
-0.132
-7.41%
jan 1, 2006
1.326
-0.328
-19.82%
jan 1, 2007
1.668
+0.342
25.79%
jan 1, 2008
2.447
+0.778
46.67%
jan 1, 2009
1.883
-0.564
-23.05%
jan 1, 2010
1.62
-0.263
-13.95%
jan 1, 2011
1.574
-0.046
-2.86%
jan 1, 2012
0.803
-0.771
-49.0%
jan 1, 2013
1.795
+0.992
123.62%
jan 1, 2014
1.435
-0.36
-20.05%
jan 1, 2015
1.383
-0.052
-3.65%
Ranking of countries by current statistics by years


Comments: