29
/
en
AIzaSyAYiBZKx7MnpbEhh9jyipgxe19OcubqV5w
April 1, 2024
154888
India
IND
true
2
1
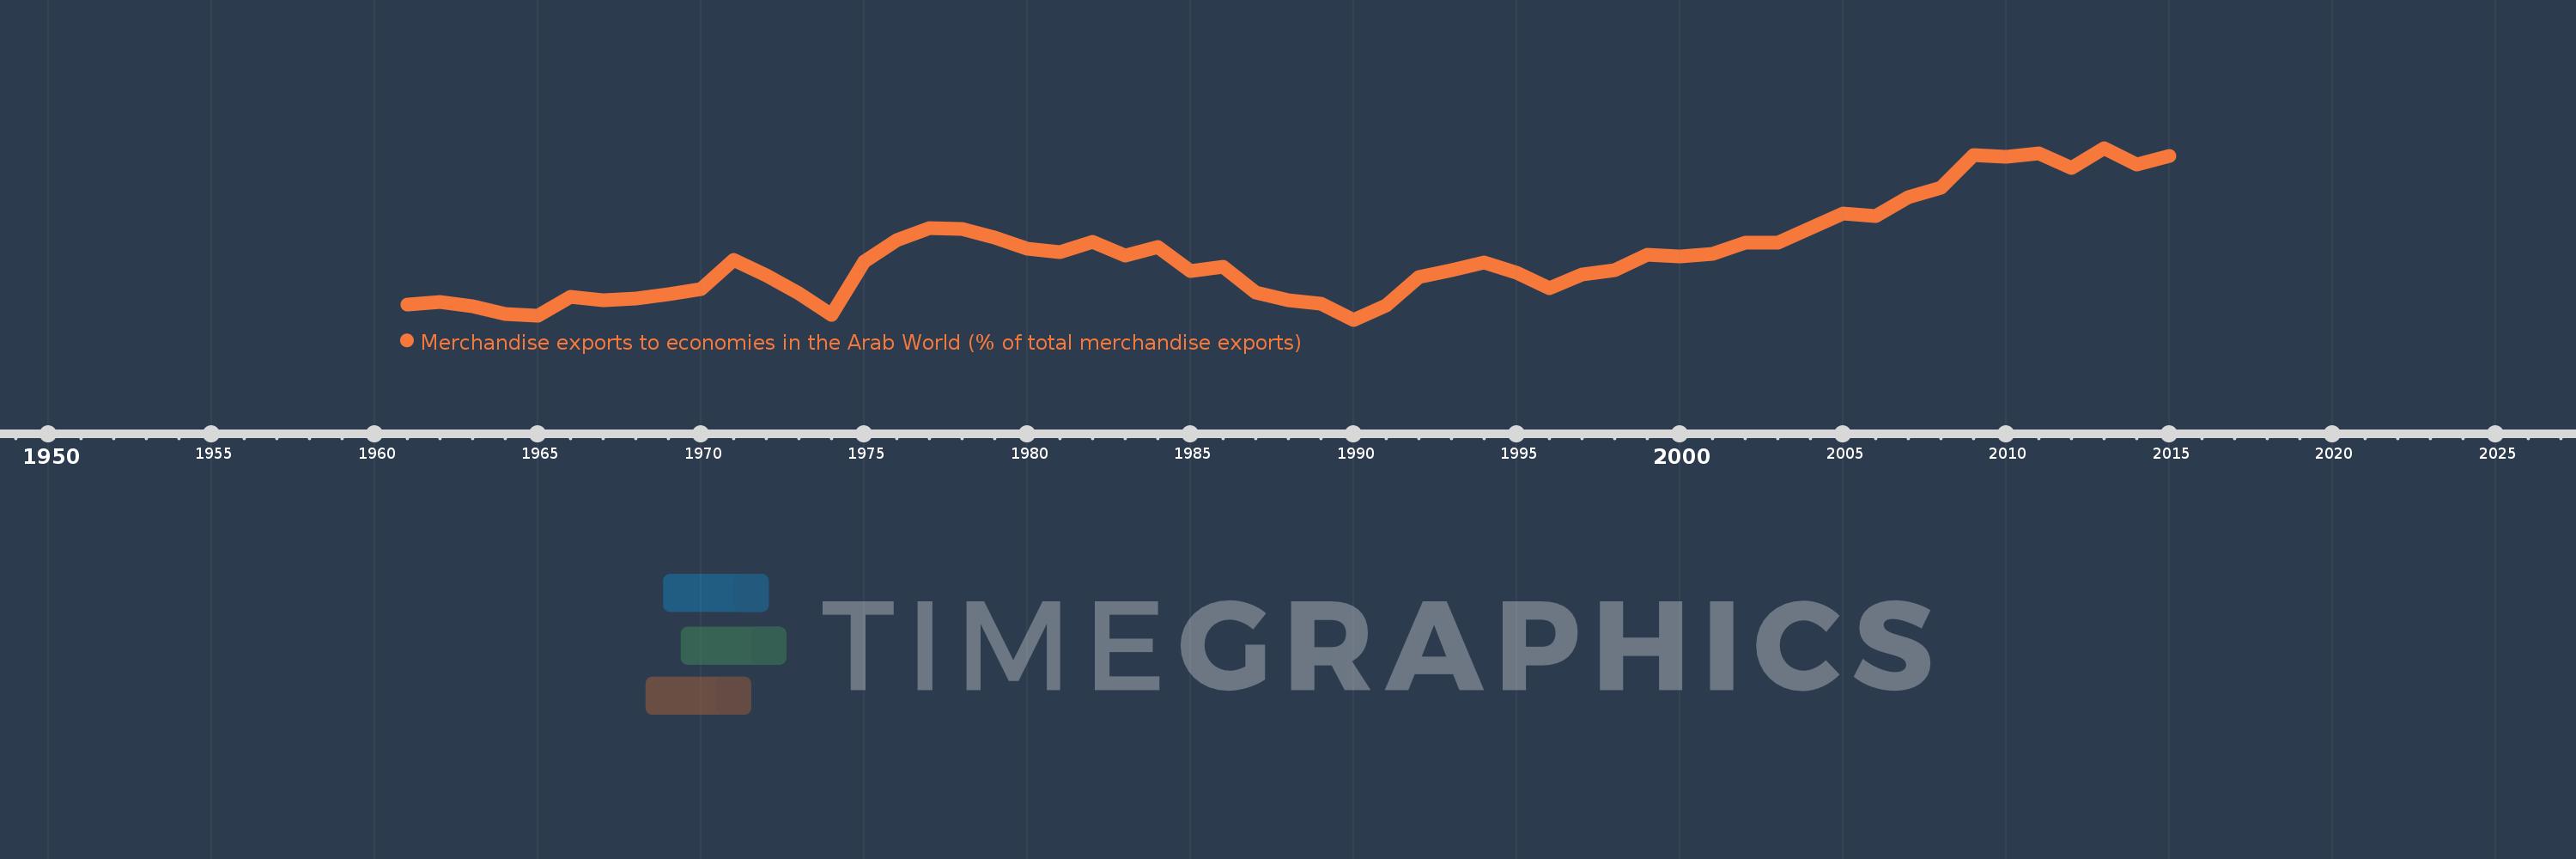
Merchandise exports to economies in the Arab World (% of total merchandise exports)
2015,2014,2013,2012,2011,2010,2009,2008,2007,2006,2005,2004,2003,2002,2001,2000,1999,1998,1997,1996,1995,1994,1993,1992,1991,1990,1989,1988,1987,1986,1985,1984,1983,1982,1981,1980,1979,1978,1977,1976,1975,1974,1973,1972,1971,1970,1969,1968,1967,1966,1965,1964,1963,1962,1961
This statistics in other country:
AfghanistanAlbaniaAlgeriaAngolaArab WorldArgentinaArmeniaArubaAustraliaAustriaAzerbaijanBahamas, TheBahrainBangladeshBarbadosBelarusBelgiumBelizeBeninBermudaBoliviaBosnia and HerzegovinaBrazilBrunei DarussalamBulgariaBurkina FasoBurundiCabo VerdeCambodiaCameroonCanadaCaribbean small statesCentral African RepublicCentral Europe and the BalticsChadChileChinaColombiaComorosCongo, Dem. Rep.Congo, Rep.Costa RicaCote d'IvoireCroatiaCubaCyprusCzech RepublicDenmarkDjiboutiDominicaDominican RepublicEarly-demographic dividendEast Asia & PacificEast Asia & Pacific (excluding high income)East Asia & Pacific (IDA & IBRD countries)EcuadorEgypt, Arab Rep.El SalvadorEstoniaEthiopiaEuro areaEurope & Central AsiaEurope & Central Asia (excluding high income)Europe & Central Asia (IDA & IBRD countries)European UnionFijiFinlandFragile and conflict affected situationsFranceGabonGambia, TheGeorgiaGermanyGhanaGreeceGreenlandGrenadaGuatemalaGuineaGuinea-BissauGuyanaHaitiHeavily indebted poor countries (HIPC)High incomeHondurasHong Kong SAR, ChinaHungaryIBRD onlyIcelandIDA & IBRD totalIDA blendIDA onlyIDA totalIndiaIndonesiaIran, Islamic Rep.IraqIrelandIsraelItalyJamaicaJapanJordanKazakhstanKenyaKorea, Dem. People’s Rep.Korea, Rep.KosovoKuwaitKyrgyz RepublicLao PDRLate-demographic dividendLatin America & Caribbean Latin America & Caribbean (excluding high income)Latin America & the Caribbean (IDA & IBRD countries)LatviaLeast developed countries: UN classificationLebanonLiberiaLibyaLithuaniaLow & middle incomeLow incomeLower middle incomeLuxembourgMacao SAR, ChinaMacedonia, FYRMadagascarMalawiMalaysiaMaldivesMaliMaltaMauritaniaMauritiusMexicoMiddle East & North AfricaMiddle East & North Africa (excluding high income)Middle East & North Africa (IDA & IBRD countries)Middle incomeMoldovaMongoliaMontenegroMoroccoMozambiqueMyanmarNepalNetherlandsNew CaledoniaNew ZealandNicaraguaNigerNigeriaNorth AmericaNorwayOECD membersOmanOther small statesPacific island small statesPakistanPanamaPapua New GuineaParaguayPeruPhilippinesPolandPortugalPost-demographic dividendPre-demographic dividendQatarRomaniaRussian FederationRwandaSamoaSaudi ArabiaSenegalSerbiaSeychellesSierra LeoneSingaporeSlovak RepublicSloveniaSmall statesSomaliaSouth AfricaSouth AsiaSouth Asia (IDA & IBRD)SpainSri LankaSt. LuciaSt. Vincent and the GrenadinesSub-Saharan Africa Sub-Saharan Africa (excluding high income)Sub-Saharan Africa (IDA & IBRD countries)SudanSurinameSwedenSwitzerlandSyrian Arab RepublicTajikistanTanzaniaThailandTogoTrinidad and TobagoTunisiaTurkeyTurkmenistanUgandaUkraineUnited Arab EmiratesUnited KingdomUnited StatesUpper middle incomeUruguayUzbekistanVenezuela, RBVietnamWorldYemen, Rep.ZambiaZimbabwe Timeline:
This timeline shows a graph from 1961 to 2015 of India. No data until 1960. Number of actual observations by date: 55.
Source name:
World Development Indicators
Source organization:
World Bank staff estimates based data from International Monetary Fund's Direction of Trade database.
Categories, topics:
Private Sector, Trade
Last updated:
apr 23, 2017
Indicators value changes by year
Maximum:
20.248
jan 1, 2013
At the date of observation
Value
Absolute change
Change from previous value
jan 1, 1961
6.555
+6.555
0.0%
jan 1, 1962
6.8
+0.245
3.73%
jan 1, 1963
6.42
-0.38
-5.59%
jan 1, 1964
5.741
-0.678
-10.57%
jan 1, 1965
5.574
-0.167
-2.91%
jan 1, 1966
7.218
+1.643
29.48%
jan 1, 1967
6.978
-0.24
-3.33%
jan 1, 1968
7.126
+0.148
2.13%
jan 1, 1969
7.496
+0.37
5.2%
jan 1, 1970
7.917
+0.421
5.61%
jan 1, 1971
10.48
+2.563
32.37%
jan 1, 1972
9.14
-1.34
-12.78%
jan 1, 1973
7.552
-1.588
-17.38%
jan 1, 1974
5.643
-1.909
-25.28%
jan 1, 1975
10.339
+4.696
83.23%
jan 1, 1976
12.193
+1.854
17.93%
jan 1, 1977
13.228
+1.035
8.49%
jan 1, 1978
13.202
-0.026
-0.2%
jan 1, 1979
12.448
-0.753
-5.71%
jan 1, 1980
11.484
-0.964
-7.75%
jan 1, 1981
11.133
-0.351
-3.05%
jan 1, 1982
12.042
+0.908
8.16%
jan 1, 1983
10.851
-1.191
-9.89%
jan 1, 1984
11.607
+0.756
6.97%
jan 1, 1985
9.478
-2.129
-18.34%
jan 1, 1986
9.857
+0.378
3.99%
jan 1, 1987
7.635
-2.222
-22.54%
jan 1, 1988
6.959
-0.676
-8.86%
jan 1, 1989
6.662
-0.296
-4.26%
jan 1, 1990
5.248
-1.414
-21.22%
jan 1, 1991
6.537
+1.288
24.54%
jan 1, 1992
8.983
+2.446
37.43%
jan 1, 1993
9.588
+0.605
6.74%
jan 1, 1994
10.277
+0.689
7.18%
jan 1, 1995
9.327
-0.95
-9.24%
jan 1, 1996
7.978
-1.349
-14.46%
jan 1, 1997
9.184
+1.206
15.12%
jan 1, 1998
9.608
+0.424
4.62%
jan 1, 1999
10.922
+1.314
13.67%
jan 1, 2000
10.807
-0.115
-1.05%
jan 1, 2001
11.023
+0.216
2.0%
jan 1, 2002
11.947
+0.924
8.38%
jan 1, 2003
11.942
-0.005
-0.04%
jan 1, 2004
13.234
+1.292
10.82%
jan 1, 2005
14.521
+1.287
9.72%
jan 1, 2006
14.268
-0.253
-1.74%
jan 1, 2007
15.921
+1.653
11.59%
jan 1, 2008
16.744
+0.822
5.17%
jan 1, 2009
19.628
+2.885
17.23%
jan 1, 2010
19.5
-0.128
-0.65%
jan 1, 2011
19.762
+0.262
1.34%
jan 1, 2012
18.507
-1.255
-6.35%
jan 1, 2013
20.248
+1.741
9.41%
jan 1, 2014
18.831
-1.418
-7.0%
jan 1, 2015
19.556
+0.725
3.85%
Ranking of countries by current statistics by years


Comments: