29
/
en
AIzaSyAYiBZKx7MnpbEhh9jyipgxe19OcubqV5w
April 1, 2024
144658
Guatemala
GTM
true
2
1
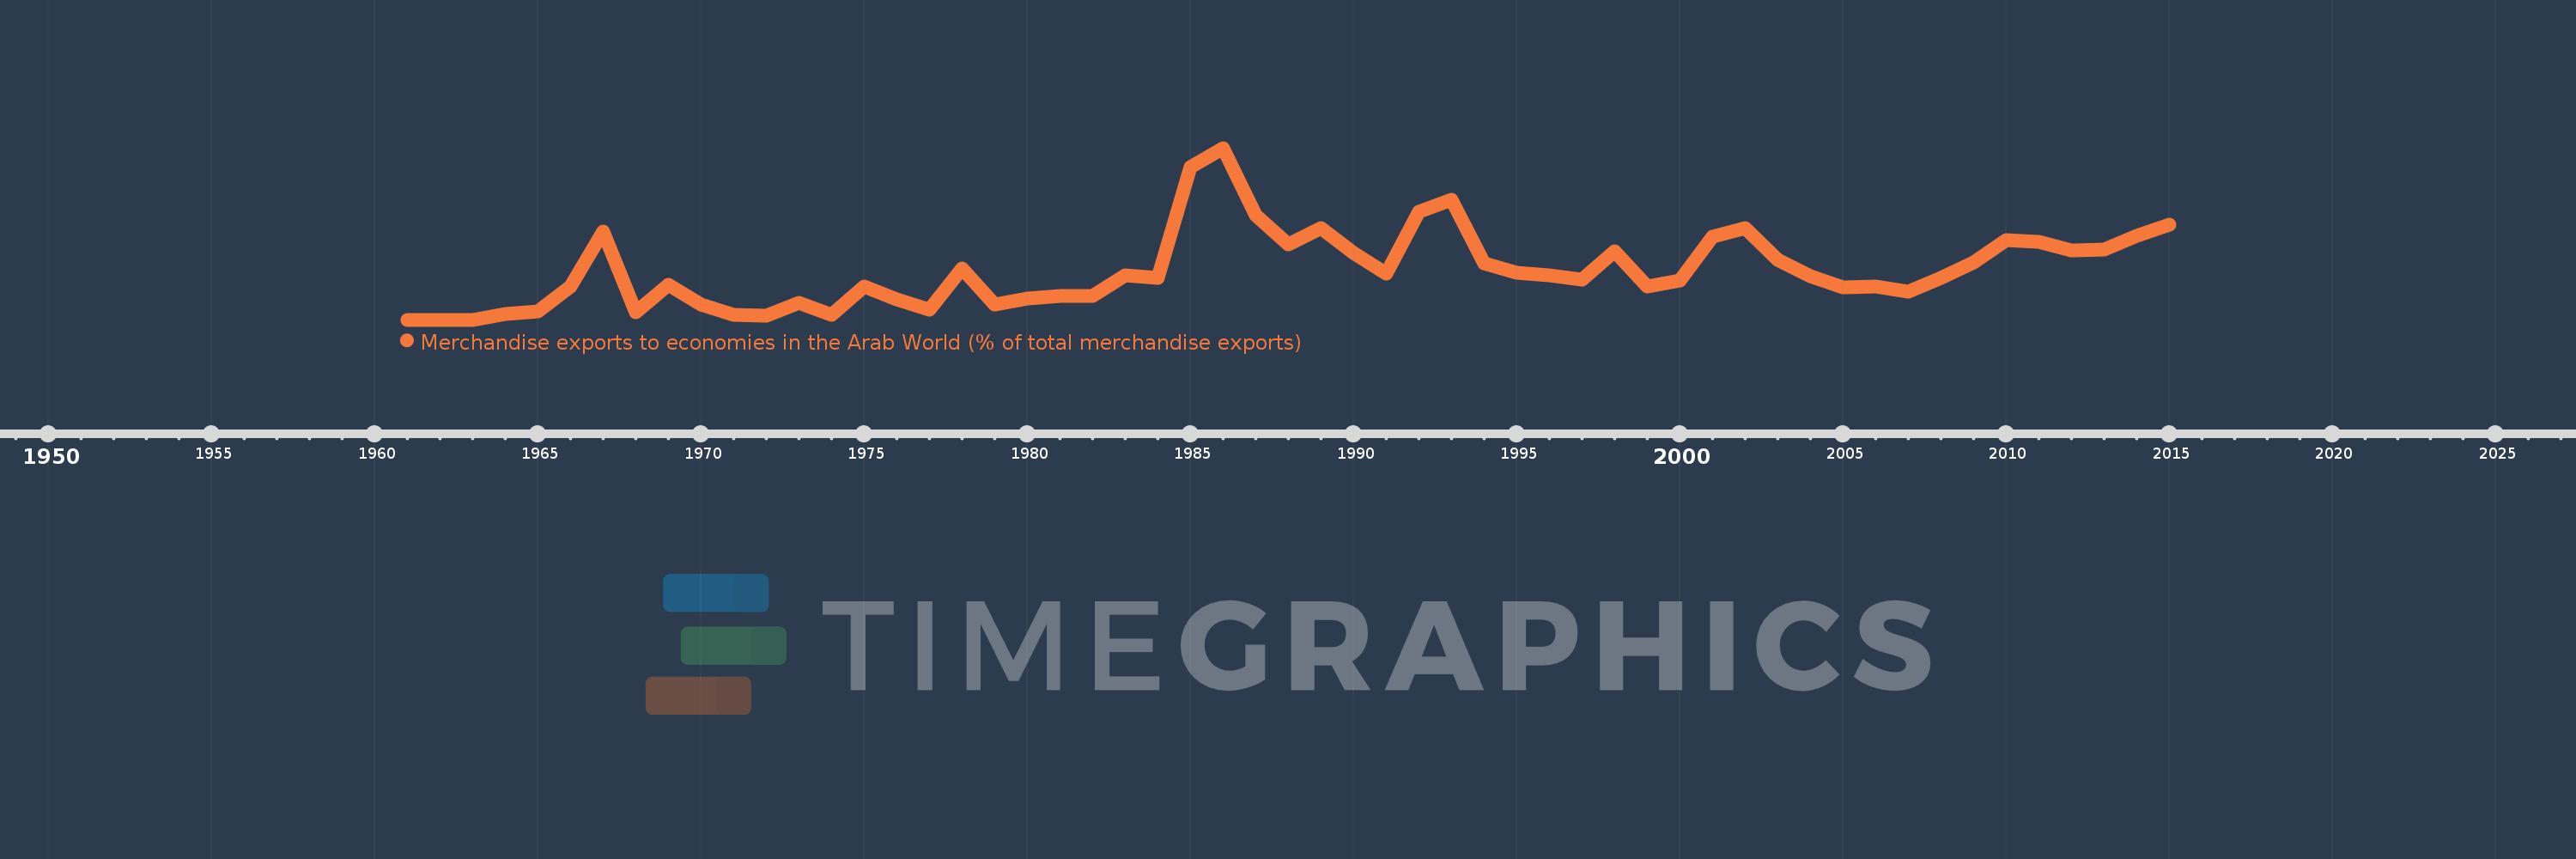
Merchandise exports to economies in the Arab World (% of total merchandise exports)
2015,2014,2013,2012,2011,2010,2009,2008,2007,2006,2005,2004,2003,2002,2001,2000,1999,1998,1997,1996,1995,1994,1993,1992,1991,1990,1989,1988,1987,1986,1985,1984,1983,1982,1981,1980,1979,1978,1977,1976,1975,1974,1973,1972,1971,1970,1969,1968,1967,1966,1965,1964,1963,1962,1961
This statistics in other country:
AfghanistanAlbaniaAlgeriaAngolaArab WorldArgentinaArmeniaArubaAustraliaAustriaAzerbaijanBahamas, TheBahrainBangladeshBarbadosBelarusBelgiumBelizeBeninBermudaBoliviaBosnia and HerzegovinaBrazilBrunei DarussalamBulgariaBurkina FasoBurundiCabo VerdeCambodiaCameroonCanadaCaribbean small statesCentral African RepublicCentral Europe and the BalticsChadChileChinaColombiaComorosCongo, Dem. Rep.Congo, Rep.Costa RicaCote d'IvoireCroatiaCubaCyprusCzech RepublicDenmarkDjiboutiDominicaDominican RepublicEarly-demographic dividendEast Asia & PacificEast Asia & Pacific (excluding high income)East Asia & Pacific (IDA & IBRD countries)EcuadorEgypt, Arab Rep.El SalvadorEstoniaEthiopiaEuro areaEurope & Central AsiaEurope & Central Asia (excluding high income)Europe & Central Asia (IDA & IBRD countries)European UnionFijiFinlandFragile and conflict affected situationsFranceGabonGambia, TheGeorgiaGermanyGhanaGreeceGreenlandGrenadaGuatemalaGuineaGuinea-BissauGuyanaHaitiHeavily indebted poor countries (HIPC)High incomeHondurasHong Kong SAR, ChinaHungaryIBRD onlyIcelandIDA & IBRD totalIDA blendIDA onlyIDA totalIndiaIndonesiaIran, Islamic Rep.IraqIrelandIsraelItalyJamaicaJapanJordanKazakhstanKenyaKorea, Dem. People’s Rep.Korea, Rep.KosovoKuwaitKyrgyz RepublicLao PDRLate-demographic dividendLatin America & Caribbean Latin America & Caribbean (excluding high income)Latin America & the Caribbean (IDA & IBRD countries)LatviaLeast developed countries: UN classificationLebanonLiberiaLibyaLithuaniaLow & middle incomeLow incomeLower middle incomeLuxembourgMacao SAR, ChinaMacedonia, FYRMadagascarMalawiMalaysiaMaldivesMaliMaltaMauritaniaMauritiusMexicoMiddle East & North AfricaMiddle East & North Africa (excluding high income)Middle East & North Africa (IDA & IBRD countries)Middle incomeMoldovaMongoliaMontenegroMoroccoMozambiqueMyanmarNepalNetherlandsNew CaledoniaNew ZealandNicaraguaNigerNigeriaNorth AmericaNorwayOECD membersOmanOther small statesPacific island small statesPakistanPanamaPapua New GuineaParaguayPeruPhilippinesPolandPortugalPost-demographic dividendPre-demographic dividendQatarRomaniaRussian FederationRwandaSamoaSaudi ArabiaSenegalSerbiaSeychellesSierra LeoneSingaporeSlovak RepublicSloveniaSmall statesSomaliaSouth AfricaSouth AsiaSouth Asia (IDA & IBRD)SpainSri LankaSt. LuciaSt. Vincent and the GrenadinesSub-Saharan Africa Sub-Saharan Africa (excluding high income)Sub-Saharan Africa (IDA & IBRD countries)SudanSurinameSwedenSwitzerlandSyrian Arab RepublicTajikistanTanzaniaThailandTogoTrinidad and TobagoTunisiaTurkeyTurkmenistanUgandaUkraineUnited Arab EmiratesUnited KingdomUnited StatesUpper middle incomeUruguayUzbekistanVenezuela, RBVietnamWorldYemen, Rep.ZambiaZimbabwe Timeline:
This timeline shows a graph from 1961 to 2015 of Guatemala. No data until 1960. Number of actual observations by date: 55.
Source name:
World Development Indicators
Source organization:
World Bank staff estimates based data from International Monetary Fund's Direction of Trade database.
Categories, topics:
Private Sector, Trade
Last updated:
apr 23, 2017
Indicators value changes by year
At the date of observation
Value
Absolute change
Change from previous value
jan 1, 1964
0.199
+0.199
%
jan 1, 1965
0.303
+0.105
52.62%
jan 1, 1966
1.183
+0.88
290.3%
jan 1, 1967
3.139
+1.955
165.23%
jan 1, 1968
0.253
-2.885
-91.93%
jan 1, 1969
1.232
+0.979
386.21%
jan 1, 1970
0.541
-0.691
-56.08%
jan 1, 1971
0.183
-0.358
-66.23%
jan 1, 1972
0.142
-0.041
-22.36%
jan 1, 1973
0.613
+0.471
332.25%
jan 1, 1974
0.163
-0.451
-73.49%
jan 1, 1975
1.17
+1.008
619.65%
jan 1, 1976
0.73
-0.44
-37.61%
jan 1, 1977
0.363
-0.368
-50.34%
jan 1, 1978
1.839
+1.477
407.32%
jan 1, 1979
0.546
-1.293
-70.3%
jan 1, 1980
0.766
+0.22
40.22%
jan 1, 1981
0.855
+0.089
11.67%
jan 1, 1982
0.853
-0.002
-0.27%
jan 1, 1983
1.594
+0.741
86.84%
jan 1, 1984
1.483
-0.111
-6.97%
jan 1, 1985
5.446
+3.963
267.34%
jan 1, 1986
6.125
+0.679
12.46%
jan 1, 1987
3.725
-2.4
-39.19%
jan 1, 1988
2.681
-1.043
-28.01%
jan 1, 1989
3.26
+0.578
21.57%
jan 1, 1990
2.369
-0.89
-27.32%
jan 1, 1991
1.659
-0.71
-29.97%
jan 1, 1992
3.847
+2.188
131.86%
jan 1, 1993
4.287
+0.441
11.45%
jan 1, 1994
2.017
-2.27
-52.95%
jan 1, 1995
1.668
-0.349
-17.32%
jan 1, 1996
1.574
-0.094
-5.61%
jan 1, 1997
1.418
-0.157
-9.94%
jan 1, 1998
2.456
+1.038
73.23%
jan 1, 1999
1.194
-1.262
-51.38%
jan 1, 2000
1.39
+0.196
16.38%
jan 1, 2001
2.973
+1.583
113.91%
jan 1, 2002
3.253
+0.28
9.43%
jan 1, 2003
2.12
-1.133
-34.83%
jan 1, 2004
1.559
-0.561
-26.46%
jan 1, 2005
1.15
-0.409
-26.21%
jan 1, 2006
1.195
+0.045
3.89%
jan 1, 2007
0.995
-0.2
-16.76%
jan 1, 2008
1.492
+0.498
50.01%
jan 1, 2009
2.036
+0.544
36.42%
jan 1, 2010
2.837
+0.801
39.36%
jan 1, 2011
2.773
-0.064
-2.26%
jan 1, 2012
2.482
-0.291
-10.5%
jan 1, 2013
2.508
+0.026
1.06%
jan 1, 2014
3.001
+0.493
19.64%
jan 1, 2015
3.39
+0.389
12.97%
Ranking of countries by current statistics by years


Comments: