29
/
en
AIzaSyAYiBZKx7MnpbEhh9jyipgxe19OcubqV5w
April 1, 2024
152782
Hungary
HUN
true
2
1
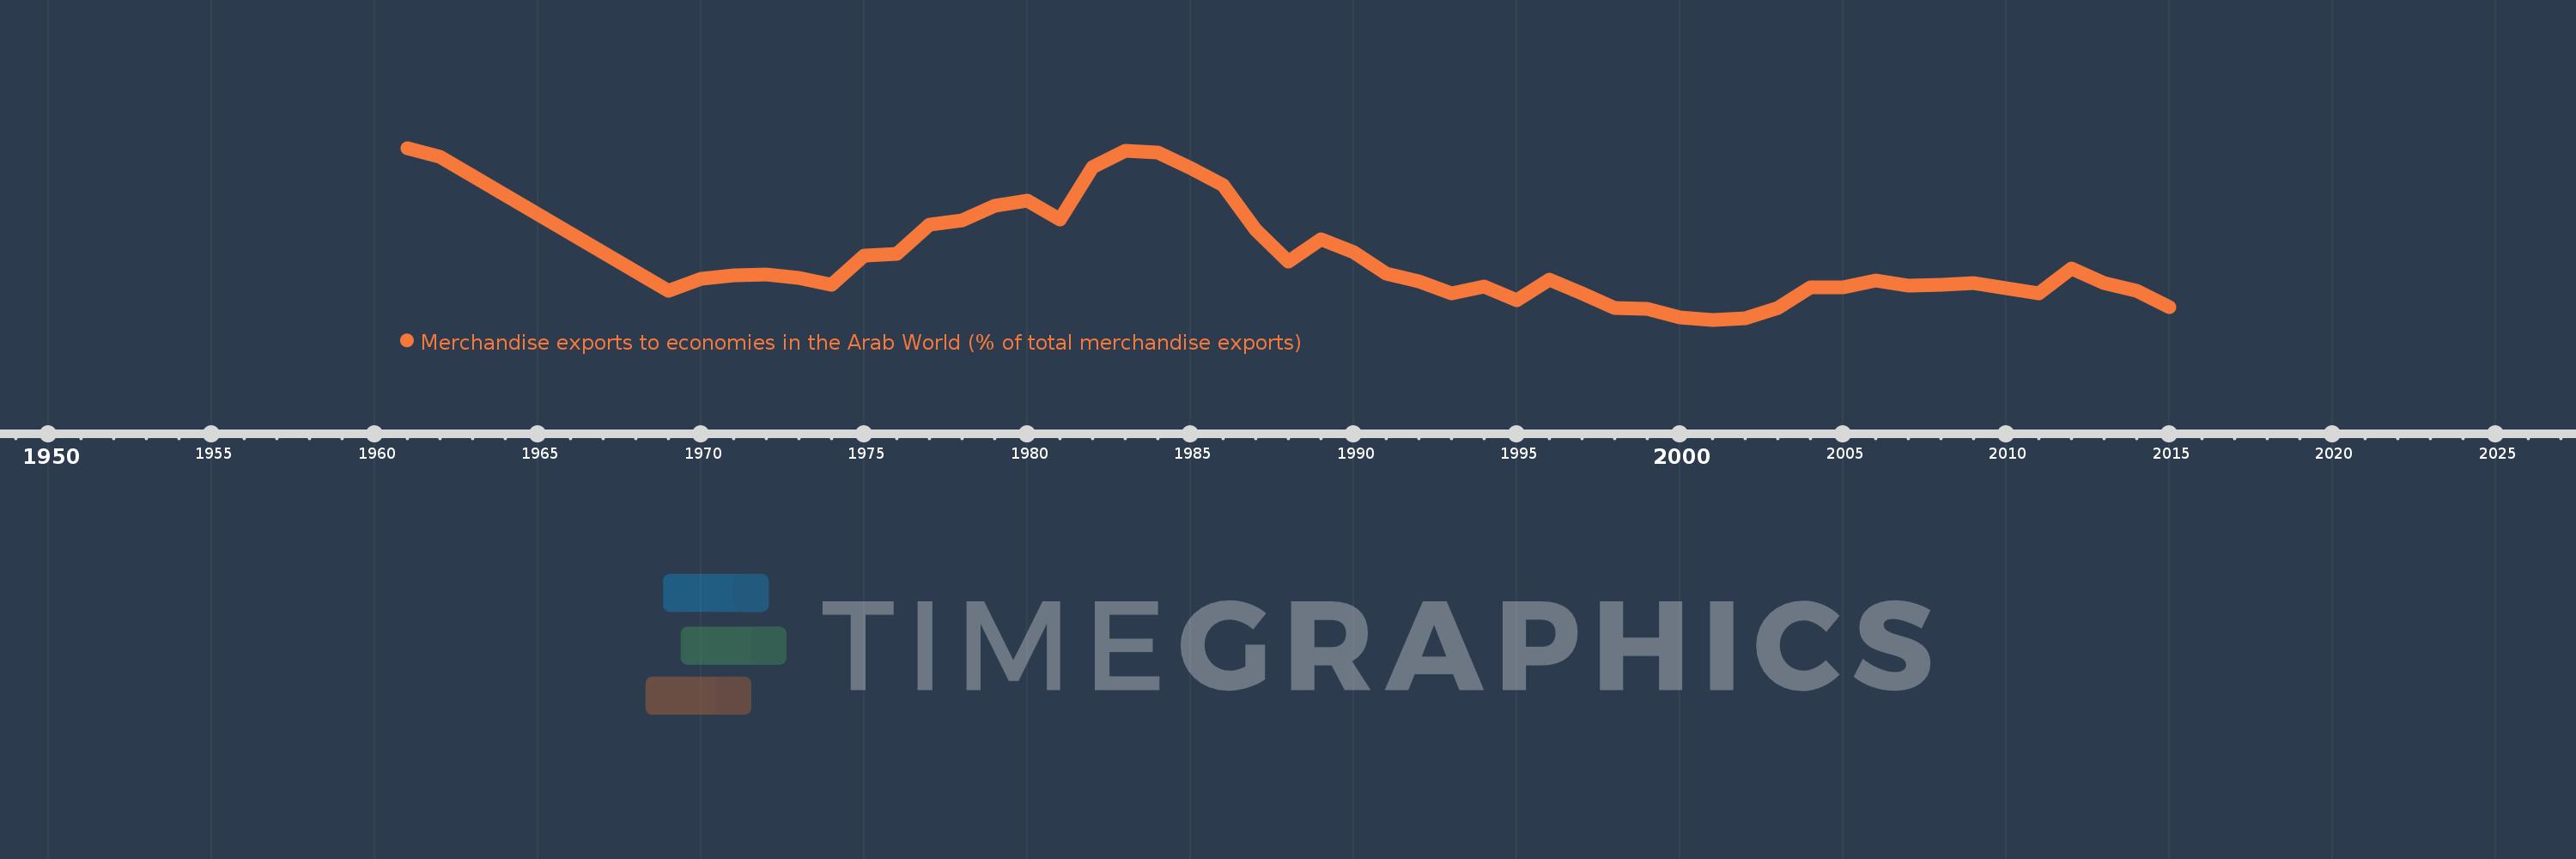
Merchandise exports to economies in the Arab World (% of total merchandise exports)
2015,2014,2013,2012,2011,2010,2009,2008,2007,2006,2005,2004,2003,2002,2001,2000,1999,1998,1997,1996,1995,1994,1993,1992,1991,1990,1989,1988,1987,1986,1985,1984,1983,1982,1981,1980,1979,1978,1977,1976,1975,1974,1973,1972,1971,1970,1969,1962,1961
This statistics in other country:
AfghanistanAlbaniaAlgeriaAngolaArab WorldArgentinaArmeniaArubaAustraliaAustriaAzerbaijanBahamas, TheBahrainBangladeshBarbadosBelarusBelgiumBelizeBeninBermudaBoliviaBosnia and HerzegovinaBrazilBrunei DarussalamBulgariaBurkina FasoBurundiCabo VerdeCambodiaCameroonCanadaCaribbean small statesCentral African RepublicCentral Europe and the BalticsChadChileChinaColombiaComorosCongo, Dem. Rep.Congo, Rep.Costa RicaCote d'IvoireCroatiaCubaCyprusCzech RepublicDenmarkDjiboutiDominicaDominican RepublicEarly-demographic dividendEast Asia & PacificEast Asia & Pacific (excluding high income)East Asia & Pacific (IDA & IBRD countries)EcuadorEgypt, Arab Rep.El SalvadorEstoniaEthiopiaEuro areaEurope & Central AsiaEurope & Central Asia (excluding high income)Europe & Central Asia (IDA & IBRD countries)European UnionFijiFinlandFragile and conflict affected situationsFranceGabonGambia, TheGeorgiaGermanyGhanaGreeceGreenlandGrenadaGuatemalaGuineaGuinea-BissauGuyanaHaitiHeavily indebted poor countries (HIPC)High incomeHondurasHong Kong SAR, ChinaHungaryIBRD onlyIcelandIDA & IBRD totalIDA blendIDA onlyIDA totalIndiaIndonesiaIran, Islamic Rep.IraqIrelandIsraelItalyJamaicaJapanJordanKazakhstanKenyaKorea, Dem. People’s Rep.Korea, Rep.KosovoKuwaitKyrgyz RepublicLao PDRLate-demographic dividendLatin America & Caribbean Latin America & Caribbean (excluding high income)Latin America & the Caribbean (IDA & IBRD countries)LatviaLeast developed countries: UN classificationLebanonLiberiaLibyaLithuaniaLow & middle incomeLow incomeLower middle incomeLuxembourgMacao SAR, ChinaMacedonia, FYRMadagascarMalawiMalaysiaMaldivesMaliMaltaMauritaniaMauritiusMexicoMiddle East & North AfricaMiddle East & North Africa (excluding high income)Middle East & North Africa (IDA & IBRD countries)Middle incomeMoldovaMongoliaMontenegroMoroccoMozambiqueMyanmarNepalNetherlandsNew CaledoniaNew ZealandNicaraguaNigerNigeriaNorth AmericaNorwayOECD membersOmanOther small statesPacific island small statesPakistanPanamaPapua New GuineaParaguayPeruPhilippinesPolandPortugalPost-demographic dividendPre-demographic dividendQatarRomaniaRussian FederationRwandaSamoaSaudi ArabiaSenegalSerbiaSeychellesSierra LeoneSingaporeSlovak RepublicSloveniaSmall statesSomaliaSouth AfricaSouth AsiaSouth Asia (IDA & IBRD)SpainSri LankaSt. LuciaSt. Vincent and the GrenadinesSub-Saharan Africa Sub-Saharan Africa (excluding high income)Sub-Saharan Africa (IDA & IBRD countries)SudanSurinameSwedenSwitzerlandSyrian Arab RepublicTajikistanTanzaniaThailandTogoTrinidad and TobagoTunisiaTurkeyTurkmenistanUgandaUkraineUnited Arab EmiratesUnited KingdomUnited StatesUpper middle incomeUruguayUzbekistanVenezuela, RBVietnamWorldYemen, Rep.ZambiaZimbabwe Timeline:
This timeline shows a graph from 1961 to 2015 of Hungary. No data until 1960. Number of actual observations by date: 49.
Source name:
World Development Indicators
Source organization:
World Bank staff estimates based data from International Monetary Fund's Direction of Trade database.
Categories, topics:
Private Sector, Trade
Last updated:
apr 23, 2017
Indicators value changes by year
At the date of observation
Value
Absolute change
Change from previous value
jan 1, 1961
7.377
+7.377
0.0%
jan 1, 1962
7.044
-0.333
-4.51%
jan 1, 1969
1.755
-5.29
-75.09%
jan 1, 1970
2.209
+0.455
25.91%
jan 1, 1971
2.358
+0.148
6.72%
jan 1, 1972
2.391
+0.034
1.43%
jan 1, 1973
2.264
-0.127
-5.33%
jan 1, 1974
1.988
-0.275
-12.16%
jan 1, 1975
3.141
+1.153
57.97%
jan 1, 1976
3.201
+0.06
1.9%
jan 1, 1977
4.365
+1.165
36.39%
jan 1, 1978
4.53
+0.164
3.77%
jan 1, 1979
5.103
+0.573
12.65%
jan 1, 1980
5.305
+0.202
3.95%
jan 1, 1981
4.565
-0.74
-13.95%
jan 1, 1982
6.607
+2.042
44.72%
jan 1, 1983
7.276
+0.669
10.13%
jan 1, 1984
7.182
-0.094
-1.29%
jan 1, 1985
6.575
-0.607
-8.46%
jan 1, 1986
5.917
-0.658
-10.01%
jan 1, 1987
4.137
-1.78
-30.08%
jan 1, 1988
2.894
-1.243
-30.05%
jan 1, 1989
3.782
+0.888
30.68%
jan 1, 1990
3.265
-0.517
-13.67%
jan 1, 1991
2.41
-0.854
-26.17%
jan 1, 1992
2.105
-0.305
-12.66%
jan 1, 1993
1.648
-0.457
-21.71%
jan 1, 1994
1.902
+0.254
15.39%
jan 1, 1995
1.356
-0.545
-28.68%
jan 1, 1996
2.179
+0.822
60.63%
jan 1, 1997
1.626
-0.553
-25.37%
jan 1, 1998
1.057
-0.569
-34.97%
jan 1, 1999
1.028
-0.029
-2.76%
jan 1, 2000
0.677
-0.351
-34.14%
jan 1, 2001
0.599
-0.078
-11.52%
jan 1, 2002
0.667
+0.068
11.38%
jan 1, 2003
1.069
+0.401
60.14%
jan 1, 2004
1.866
+0.797
74.57%
jan 1, 2005
1.869
+0.004
0.2%
jan 1, 2006
2.144
+0.275
14.71%
jan 1, 2007
1.952
-0.192
-8.96%
jan 1, 2008
1.982
+0.029
1.51%
jan 1, 2009
2.046
+0.065
3.26%
jan 1, 2010
1.837
-0.209
-10.23%
jan 1, 2011
1.632
-0.205
-11.16%
jan 1, 2012
2.607
+0.975
59.74%
jan 1, 2013
2.05
-0.557
-21.36%
jan 1, 2014
1.745
-0.305
-14.89%
jan 1, 2015
1.112
-0.633
-36.26%
Ranking of countries by current statistics by years


Comments: